

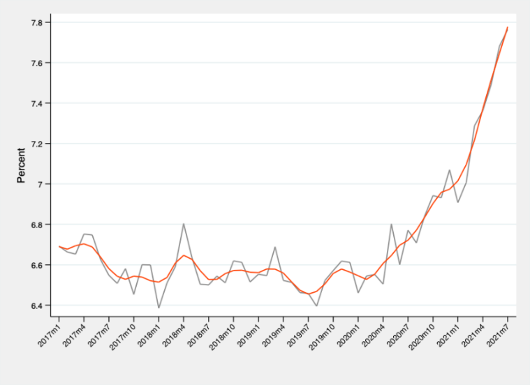
The cost of shipping goods has risen rapidly during the past 18 months. The average freight rate of US imports, based on cargo value, has gained a full percentage point relative to pre-pandemic levels (see Figure 1).[1] The average freight cost of a global 40-foot container has increased more than five times since the pandemic started, with routes such as Shanghai-to-Los Angeles increasing more than eight times.
In this blog, we provide some initial insights into the nature and drivers of this trend in transportation costs and discuss some of its implications for Latin America and the Caribbean.
Figure 1: Average ad valorem freight rate of US imports
Shipping costs across products and regions
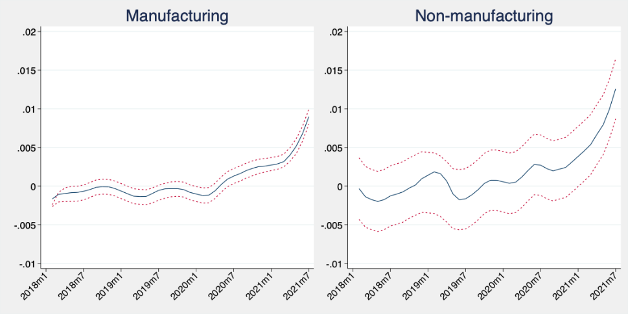
Focusing on US imports from all countries in the world, Figure 2 presents the deviation from “normal levels” of ad valorem freight rates for manufacture and non-manufacture (agricultural and mining) products. [2] A band above zero indicates higher than “normal” shipping rates, given the composition of trade across partner countries and seasonality.[3] The results reveal that the shipment of manufactured goods started to significantly deviate in the second half of 2020. Instead, freight rates for non-manufactured goods showed more heterogeneity over time and only significantly diverged from the benchmark in more recent months.[4]
Figure 2: Ad valorem freight rate of US imports, by sector
(Deviations from normal levels)
A similar exercise based on the origin regions (Figure 3) shows that imports from Asia seem to be driving most of the increase in the freight rates. In particular, shipping costs associated with US imports from Asia trended above normal much earlier. They exhibit much higher levels than their counterparts linked to US imports from Latin America and Europe, which only trended above normal in recent months.
Figure 3: Ad valorem freight rate of US imports, by selected origin regions
(Deviations from normal levels)
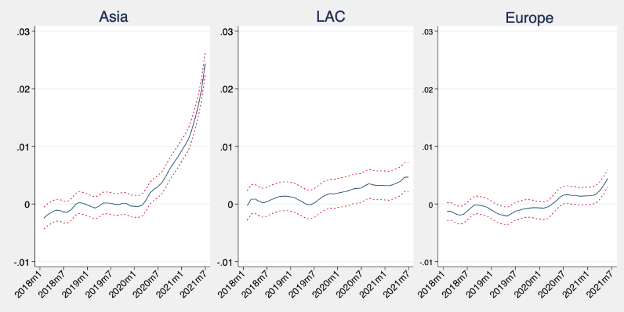
Overall, Figures 2 and 3 provide some indication that Asia’s manufacturing imports are playing a central role behind the recent rise in shipping costs. The next question is why?
Drivers of rising shipping costs
A confluence of forces, mostly related to COVID-19, appears to be behind these trends. On the one hand, the need to implement measures to stop the spread of the virus meant longer processing times at ports, leading to congestion, bottlenecks, and rising costs. In principle, this would have affected imports from all origins, but as shown in Figure 3, the imports from Asia led this charge.
Thus, additional factors should be at play. One of the explanations is a sharp increase in the demand for Asian imports as the result of COVID-related shifts in consumption patterns. Incentivized by the lockdowns, spending shifted away from services, such as movies, restaurants, and gym memberships to physical goods.
This shift in consumption patterns towards manufacturing goods was met largely by Asian imports. For example, during the first seven months of 2021, the imports from Asia were already up by 11.7% compared to a similar period in 2019, while the imports from Latin America and Europe were up by only 2.9% and 2.5%, respectively.[5]
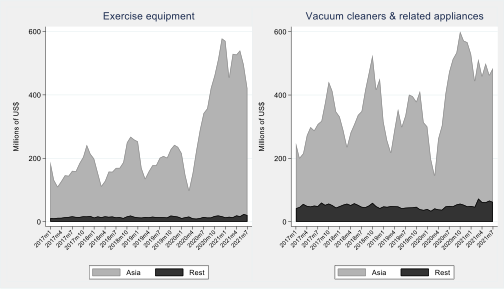
An example that vividly illustrates both the change in consumption patterns and the higher demand for manufactured goods from Asia is the sharp increase in the imports of exercise equipment. Induced by the lockdowns -including gym closures- the demand for exercise cycles, treadmills, rowing machines and other exercise equipment skyrocketed. In the first 7 months of 2021, for example, the total US imports of exercise equipment were up by 167% compared to a similar period in 2019. This sudden increase in demand was met mostly by Asia, as shown in Figure 4 (left panel).[6]
Another example is the increased demand for home appliances, as people spend more time at home. The right panel of Figure 4, for example, shows the increase in demand for vacuum cleaners and similar appliances, which was once again met primarily by Asia.
Figure 4: US imports
Overall, the COVID-induced surge in demand for manufactured (consumer) goods, primarily met by Asian countries, faced supply-side constraints related to longer processing times, port congestion, and delays, feeding the increase in shipping costs.[7] An additional limitation is that the supply capacity in the shipping industry takes time to react.[8]
A domino effect
The phenomenon described above is becoming more global. A container kept on land for longer than usual cannot be used on new shipments or additional routes. Similarly, ships that embark to serve routes with high shipping fees, deprive other routes of capacity.[9] Figures 2 and 3 already show some signs of this domino effect, as freights associated with Latin America and Europe as well as those associated with non-manufactured goods are rising above normal levels recently.
Looking ahead
Given the nature of the forces involved, it would seem reasonable to expect this shock to be temporary. As the number of vaccinated individuals increases and pandemic restrictions are lifted, consumers should begin to divert their spending back to restaurants, hotels, gym memberships, and other services, easing pressure on imports of goods. Similarly, measures in port operations that prolong processing times should be expected to decrease as the pandemic is brought under control, reducing delays and congestions. But temporary neither means immediately -as current conditions may persist for some time- nor that it cannot have lasting consequences.
In the meantime, more analyses are clearly needed. Current work at the Inter-American Development Bank’s Integration and Trade Sector includes separating shipping costs trends by port location (in the US); delving deeper into the relationship between lockdowns and transportation costs; and estimating the impact of increased shipping rates on trade flows from the region, along both the extensive margin (number of exporting firms) and the intensive margin (average exports per firm) and across different goods categories (e.g., intermediate vs. final), among others. The results of these studies will provide insights that will help countries identify the appropriate policy responses and guide IDB’s operative support to these initiatives.
[1] Red line corresponds to smoothed values.
[2] We refer to normal levels, as the levels that can be explained by historical country and product factors. More technically, the figure reports the coefficient estimates for the variable T in the following regression: Y(cpym)=FE(cp)+FE(m)+Z(jj) x T(ym)+e(cpym); where Y(cpym) is the ad valorem freight rate associated with the US imports from country c, product p, year y and month m; FE(cp) is a fixed effect at the country-product level; FE(m) is a fixed effect at the month level; Z(jj) is an indicator variable for each product category (or origin region category in Figure 3), T(ym) is a fixed effect at the year-month level, and e(cpym) is the error term.
[3] The band represents 95% confidence intervals.
[4] The higher dispersion of non-manufacturing goods’ freight rates is reflected in the broadness of the band depicting their evolution.
[5] Asian imports of consumption goods and capital goods experienced the largest expansions, as they were up by 15.3% and 14.8% in the first seven months of 2021 relative to the same period in 2019.
[6] The share of Asia went from 92% in the first seven months of 2019 to 97% in the first seven months of 2021.
[7] This does not preclude the role of other factors, like rises in the price of fuel and the consequences associated with changes in the structure in the shipping industry over the last decade.
[8] For instance, it can take one year to build a container ship.
[9] More containers are leaving Asia than returning, and excess containers are sitting at ports with no way to “get home”.