
MCLEAN, Va.–(BUSINESS WIRE)–Hilton Worldwide Holdings Inc. (“Hilton,” “the Company,” “we,” “us” or “our”) (NYSE: HLT) today reported its second quarter 2025 results. Highlights include:
![]()
![]()

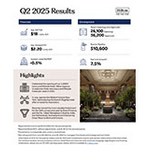
- Diluted EPS was $1.84 for the second quarter, and diluted EPS, adjusted for special items, was $2.20
- Net income was $442 million for the second quarter
- Adjusted EBITDA was $1,008 million for the second quarter
- System-wide comparable RevPAR declined 0.5 percent, on a currency neutral basis, for the second quarter compared to the same period in 2024
- Approved 36,200 new rooms for development during the second quarter, bringing our development pipeline to a record 510,600 rooms as of June 30, 2025, up 4 percent compared to June 30, 2024 excluding the impact of acquisitions and strategic partner hotels
- Added 26,100 rooms to our system, resulting in 22,600 net additional rooms for the second quarter, contributing to net unit growth of 7.5 percent from June 30, 2024
- Issued $1.0 billion aggregate principal amount of 5.750% Senior Notes due 2033 in July 2025 (the “July Senior Notes issuance”)
- Repurchased 3.2 million shares of Hilton common stock during the second quarter; bringing total capital return, including dividends, to $791 million for the quarter and $1,881 million year to date through July
- Full year 2025 system-wide RevPAR is projected to be flat to an increase of 2.0 percent on a comparable and currency neutral basis compared to 2024; full year net income is projected to be between $1,640 million and $1,682 million; full year Adjusted EBITDA is projected to be between $3,650 million and $3,710 million
- Full year 2025 capital return is projected to be approximately $3.3 billion
Overview
Christopher J. Nassetta, President & Chief Executive Officer of Hilton, said, “We continued to demonstrate the power of our resilient business model as we delivered strong bottom line results in the quarter, even with modestly negative top line performance given holiday and calendar shifts, reduced government spending, softer international inbound business and broader economic uncertainty. With that being said, we believe the economy in our largest market is set up for better growth over the intermediate term, which should accelerate travel demand and, when paired with low industry supply growth, unlock stronger RevPAR growth. On the development side, we achieved the largest pipeline in our history, and we remain confident in our ability to deliver net unit growth between 6.0 percent and 7.0 percent for the next several years.”
For the three months ended June 30, 2025, system-wide comparable RevPAR decreased 0.5 percent compared to the same period in 2024 due to modest occupancy declines, partially mitigated by ADR gains. Management and franchise fee revenues increased 7.9 percent compared to the same period in 2024.
For the six months ended June 30, 2025, system-wide comparable RevPAR increased 1.0 percent compared to the same period in 2024 due to an increase in ADR. Management and franchise fee revenues increased 6.6 percent compared to the same period in 2024.
For the three months ended June 30, 2025, diluted EPS was $1.84 and diluted EPS, adjusted for special items, was $2.20, compared to $1.67 and $1.91, respectively, for the three months ended June 30, 2024. Net income and Adjusted EBITDA were $442 million and $1,008 million, respectively, for the three months ended June 30, 2025, compared to $422 million and $917 million, respectively, for the three months ended June 30, 2024.
For the six months ended June 30, 2025, diluted EPS was $3.07 and diluted EPS, adjusted for special items, was $3.92, compared to $2.71 and $3.44, respectively, for the six months ended June 30, 2024. Net income and Adjusted EBITDA were $742 million and $1,803 million, respectively, for the six months ended June 30, 2025, compared to $690 million and $1,667 million, respectively, for the six months ended June 30, 2024.
Development
In the second quarter of 2025, we opened 221 hotels, totaling 26,100 rooms, resulting in 22,600 net room additions. We continued to expand our luxury and lifestyle brands bringing the portfolio to more than 1,000 hotels across the world. Notable openings included the Sax Paris, LXR Hotels & Resorts, which is the brand’s first hotel in the heart of Paris, The Marcus Portrush, Tapestry Collection by Hilton, and the Hotel Astoria Vienna, Curio Collection by Hilton, representing these lifestyle brands’ debuts in Northern Ireland and Vienna, Austria, respectively. Building on this momentum, we also signed the NoMad Detroit and NoMad Singapore, further expanding our luxury and lifestyle pipeline. In July 2025, we celebrated the opening of our first LivSmart Studios by Hilton in Tullahoma, Tennessee, as well as the opening of the iconic Waldorf Astoria New York just last week.
We added 36,200 rooms to the development pipeline during the second quarter, and, as of June 30, 2025, our development pipeline totaled 3,636 hotels representing 510,600 rooms throughout 128 countries and territories, including 29 countries and territories where we had no existing hotels. Additionally, of the rooms in the development pipeline, nearly half were under construction and more than half were located outside of the U.S.
Balance Sheet and Liquidity
In the second quarter of 2025, we used proceeds from borrowings under our senior secured revolving credit facility (the “Revolving Credit Facility”), together with available cash, to repay, at maturity, all $500 million in aggregate principal amount of the 5.375% Senior Notes due May 2025, plus accrued and unpaid interest.
As of June 30, 2025, we had $11.0 billion of debt outstanding, excluding the deduction for unamortized deferred financing costs and discount, with a weighted average interest rate of 4.76 percent. Excluding all finance lease liabilities, we had $10.9 billion of debt outstanding with a weighted average interest rate of 4.75 percent and no material indebtedness that matures prior to April 2027. We believe that we have sufficient sources of liquidity and access to debt financing to address the repayment of all indebtedness that becomes due at or prior to the respective maturity dates. As of June 30, 2025, $290 million of borrowings were outstanding under our $2.0 billion Revolving Credit Facility, which had an available borrowing capacity of $1,618 million after considering $92 million of outstanding letters of credit. In July 2025, we borrowed an additional $225 million under our Revolving Credit Facility and subsequently used a portion of the net proceeds from the July Senior Notes issuance to repay all $515 million of outstanding indebtedness under our Revolving Credit Facility. Total cash and cash equivalents were $448 million as of June 30, 2025, including $77 million of restricted cash and cash equivalents.
In June 2025, we paid a quarterly cash dividend of $0.15 per share of common stock, for a total payment of $36 million, bringing total dividend payments for the year to $73 million. In July 2025, our board of directors authorized a regular quarterly cash dividend of $0.15 per share of common stock to be paid on September 30, 2025 to holders of record of our common stock as of the close of business on August 29, 2025.
During the three months ended June 30, 2025, we repurchased 3.2 million shares of Hilton common stock at an average price per share of $235.36, for a total of $755 million. During the six months ended June 30, 2025, we repurchased 6.9 million shares of Hilton common stock at an average price per share of $239.39, returning $1,718 million of capital to shareholders, including dividends. Total capital return to shareholders, including dividends year-to-date through July, was $1,881 million.
The number of shares outstanding as of July 18, 2025 was 235.2 million.
Outlook
Share-based metrics in Hilton’s outlook include actual share repurchases through the second quarter but do not include the effects of potential share repurchases thereafter.
Full Year 2025
- System-wide comparable RevPAR, on a currency neutral basis, is projected to be flat to an increase of 2.0 percent compared to 2024.
- Diluted EPS is projected to be between $6.82 and $6.99.
- Diluted EPS, adjusted for special items, is projected to be between $7.83 and $8.00.
- Net income is projected to be between $1,640 million and $1,682 million.
- Adjusted EBITDA is projected to be between $3,650 million and $3,710 million.
- Contract acquisition costs and capital expenditures, excluding amounts reimbursed by third parties, are projected to be between $250 million and $300 million.
- Capital return is projected to be approximately $3.3 billion.
- General and administrative expenses are projected to be between $420 million and $430 million.
- Net unit growth is projected to be between 6.0 percent and 7.0 percent.
Third Quarter 2025
- System-wide comparable RevPAR, on a currency neutral basis, is projected to be flat to modestly down compared to the third quarter of 2024.
- Diluted EPS is projected to be between $1.89 and $1.95.
- Diluted EPS, adjusted for special items, is projected to be between $1.98 and $2.04.
- Net income is projected to be between $453 million and $467 million.
- Adjusted EBITDA is projected to be between $935 million and $955 million.
Conference Call
Hilton will host a conference call to discuss second quarter of 2025 results on July 23, 2025 at 9:00 a.m. Eastern Time. Participants may listen to the live webcast by logging on to the Hilton Investor Relations website at https://ir.hilton.com/events-and-presentations. A replay and transcript of the webcast will be available within 24 hours after the live event at https://ir.hilton.com/financial-reporting.
Alternatively, participants may listen to the live call by dialing 1-888-317-6003 in the United States (“U.S.”) or 1-412-317-6061 internationally using the conference ID 2907103. Participants are encouraged to dial into the call or link to the webcast at least fifteen minutes prior to the scheduled start time. A telephone replay will be available for seven days following the call. To access the telephone replay, dial 1-877-344-7529 in the U.S. or 1-412-317-0088 internationally using the conference ID 2729714.
Forward-Looking Statements
This press release contains forward-looking statements within the meaning of Section 27A of the Securities Act of 1933, as amended, and Section 21E of the Securities Exchange Act of 1934, as amended. These statements include, but are not limited to, statements related to our expectations regarding the performance of our business, future financial results, liquidity and capital resources and other non-historical statements. In some cases, you can identify these forward-looking statements by the use of words such as “outlook,” “believes,” “expects,” “forecasts,” “potential,” “continues,” “may,” “will,” “should,” “could,” “seeks,” “projects,” “predicts,” “intends,” “plans,” “estimates,” “anticipates” or the negative version of these words or other comparable words. Such forward-looking statements are subject to various risks and uncertainties including, among others, risks inherent to the hospitality industry; macroeconomic factors beyond our control, such as inflation, changes in interest rates, challenges due to labor shortages or disputes and supply chain disruptions; the loss of key senior management personnel; competition for hotel guests and management and franchise contracts; risks related to doing business with third-party hotel owners; performance of our information technology systems; growth of reservation channels outside of our system; risks of doing business outside of the U.S.; risks associated with conflicts in Eastern Europe and the Middle East; uncertainty resulting from U.S. and global political trends, tariffs and other policies, including potential barriers to travel, trade and immigration and other geopolitical events; and our indebtedness. Additional factors that could cause our results to differ materially from those described in the forward-looking statements can be found under the section entitled “Part I—Item 1A. Risk Factors” of our Annual Report on Form 10-K for the fiscal year ended December 31, 2024, which is filed with the Securities and Exchange Commission (the “SEC”) and is accessible on the SEC’s website at www.sec.gov. Accordingly, there are or will be important factors that could cause actual outcomes or results to differ materially from those indicated in these statements. These factors should not be construed as exhaustive and should be read in conjunction with the other cautionary statements that are included in this press release and in our filings with the SEC. We undertake no obligation to publicly update or review any forward-looking statement, whether as a result of new information, future developments or otherwise, except as required by law.
Definitions
See the “Definitions” section for the definition of certain terms used within this press release, including within the schedules.
Non-GAAP Financial Measures
We refer to certain financial measures that are not recognized under U.S. generally accepted accounting principles (“GAAP”) in this press release, including: net income, adjusted for special items; diluted EPS, adjusted for special items; Adjusted EBITDA; Adjusted EBITDA margin; net debt; and net debt to Adjusted EBITDA ratio. See the schedules to this press release, including the “Definitions” section, for additional information and reconciliations of such non-GAAP financial measures, as well as the most comparable GAAP financial measures.
About Hilton
Hilton (NYSE: HLT) is a leading global hospitality company with a portfolio of 24 world-class brands comprising more than 8,800 properties and over 1.3 million rooms, in 139 countries and territories. Dedicated to fulfilling its founding vision to fill the earth with the light and warmth of hospitality, Hilton has welcomed over 3 billion guests in its more than 100-year history, was named the No.1 World’s Best Workplace by Great Place to Work and Fortune and has been recognized as a global leader on the Dow Jones Sustainability Indices. Hilton has introduced industry-leading technology enhancements to improve the guest experience, including Digital Key Share, automated complimentary room upgrades and the ability to book confirmed connecting rooms. Through the award-winning guest loyalty program Hilton Honors, the more than 226 million Hilton Honors members who book directly with Hilton can earn Points for hotel stays and experiences money can’t buy. With the free Hilton Honors app, guests can book their stay, select their room, check in, unlock their door with a Digital Key and check out, all from their smartphone. Visit stories.hilton.com for more information, and connect with Hilton on facebook.com/hiltonnewsroom, x.com/hiltonnewsroom, linkedin.com/company/hilton, instagram.com/hiltonnewsroom and youtube.com/hiltonnewsroom.
|
HILTON WORLDWIDE HOLDINGS INC. EARNINGS RELEASE SCHEDULES TABLE OF CONTENTS |
|
|
|
Condensed Consolidated Statements of Operations |
|
Comparable and Currency Neutral System-Wide Hotel Operating Statistics |
|
Property Summary |
|
Capital Expenditures and Contract Acquisition Costs |
|
Reconciliations of Non-GAAP Financial Measures |
|
Definitions |
|
HILTON WORLDWIDE HOLDINGS INC. CONDENSED CONSOLIDATED STATEMENTS OF OPERATIONS (in millions, except per share amounts) (unaudited) |
|||||||||||||||
|
|
Three Months Ended |
|
Six Months Ended |
||||||||||||
|
|
June 30, |
|
June 30, |
||||||||||||
|
|
2025 |
|
2024 |
|
2025 |
|
2024 |
||||||||
|
Revenues |
|
|
|
|
|
|
|
||||||||
|
Franchise and licensing fees |
$ |
745 |
|
|
$ |
689 |
|
|
$ |
1,370 |
|
|
$ |
1,260 |
|
|
Base and other management fees |
|
97 |
|
|
|
93 |
|
|
|
185 |
|
|
|
199 |
|
|
Incentive management fees |
|
75 |
|
|
|
68 |
|
|
|
147 |
|
|
|
138 |
|
|
Ownership |
|
332 |
|
|
|
337 |
|
|
|
566 |
|
|
|
592 |
|
|
Other revenues |
|
77 |
|
|
|
71 |
|
|
|
123 |
|
|
|
121 |
|
|
|
|
1,326 |
|
|
|
1,258 |
|
|
|
2,391 |
|
|
|
2,310 |
|
|
Cost reimbursement revenues |
|
1,811 |
|
|
|
1,693 |
|
|
|
3,441 |
|
|
|
3,214 |
|
|
Total revenues |
|
3,137 |
|
|
|
2,951 |
|
|
|
5,832 |
|
|
|
5,524 |
|
|
|
|
|
|
|
|
|
|
||||||||
|
Expenses |
|
|
|
|
|
|
|
||||||||
|
Ownership |
|
286 |
|
|
|
298 |
|
|
|
525 |
|
|
|
545 |
|
|
Depreciation and amortization |
|
43 |
|
|
|
34 |
|
|
|
84 |
|
|
|
70 |
|
|
General and administrative |
|
109 |
|
|
|
113 |
|
|
|
203 |
|
|
|
217 |
|
|
Other expenses |
|
26 |
|
|
|
37 |
|
|
|
52 |
|
|
|
67 |
|
|
|
|
464 |
|
|
|
482 |
|
|
|
864 |
|
|
|
899 |
|
|
Reimbursed expenses |
|
1,895 |
|
|
|
1,744 |
|
|
|
3,654 |
|
|
|
3,374 |
|
|
Total expenses |
|
2,359 |
|
|
|
2,226 |
|
|
|
4,518 |
|
|
|
4,273 |
|
|
|
|
|
|
|
|
|
|
||||||||
|
Gain on sales of assets, net |
|
— |
|
|
|
— |
|
|
|
— |
|
|
|
7 |
|
|
|
|
|
|
|
|
|
|
||||||||
|
Operating income |
|
778 |
|
|
|
725 |
|
|
|
1,314 |
|
|
|
1,258 |
|
|
|
|
|
|
|
|
|
|
||||||||
|
Interest expense |
|
(151 |
) |
|
|
(141 |
) |
|
|
(296 |
) |
|
|
(272 |
) |
|
Gain (loss) on foreign currency transactions |
|
(1 |
) |
|
|
(1 |
) |
|
|
1 |
|
|
|
(2 |
) |
|
Other non-operating income (loss), net |
|
3 |
|
|
|
8 |
|
|
|
20 |
|
|
|
(28 |
) |
|
|
|
|
|
|
|
|
|
||||||||
|
Income before income taxes |
|
629 |
|
|
|
591 |
|
|
|
1,039 |
|
|
|
956 |
|
|
|
|
|
|
|
|
|
|
||||||||
|
Income tax expense |
|
(187 |
) |
|
|
(169 |
) |
|
|
(297 |
) |
|
|
(266 |
) |
|
|
|
|
|
|
|
|
|
||||||||
|
Net income |
|
442 |
|
|
|
422 |
|
|
|
742 |
|
|
|
690 |
|
|
Net income attributable to redeemable and nonredeemable noncontrolling interests |
|
(2 |
) |
|
|
(1 |
) |
|
|
(2 |
) |
|
|
(4 |
) |
|
Net income attributable to Hilton stockholders |
$ |
440 |
|
|
$ |
421 |
|
|
$ |
740 |
|
|
$ |
686 |
|
|
|
|
|
|
|
|
|
|
||||||||
|
Weighted average shares outstanding: |
|
|
|
|
|
|
|
||||||||
|
Basic |
|
237 |
|
|
|
249 |
|
|
|
239 |
|
|
|
251 |
|
|
Diluted |
|
239 |
|
|
|
252 |
|
|
|
241 |
|
|
|
253 |
|
|
|
|
|
|
|
|
|
|
||||||||
|
Earnings per share: |
|
|
|
|
|
|
|
||||||||
|
Basic |
$ |
1.85 |
|
|
$ |
1.69 |
|
|
$ |
3.10 |
|
|
$ |
2.74 |
|
|
Diluted |
$ |
1.84 |
|
|
$ |
1.67 |
|
|
$ |
3.07 |
|
|
$ |
2.71 |
|
|
|
|
|
|
|
|
|
|
||||||||
|
Cash dividends declared per share |
$ |
0.15 |
|
|
$ |
0.15 |
|
|
$ |
0.30 |
|
|
$ |
0.30 |
|
|
HILTON WORLDWIDE HOLDINGS INC. COMPARABLE AND CURRENCY NEUTRAL SYSTEM-WIDE HOTEL OPERATING STATISTICS BY REGION, BRAND AND SEGMENT (unaudited) |
||||||||||||||||||
|
|
Three Months Ended June 30, |
|||||||||||||||||
|
|
Occupancy |
|
ADR |
|
RevPAR |
|||||||||||||
|
|
2025 |
|
vs. 2024 |
|
2025 |
|
vs. 2024 |
|
2025 |
|
vs. 2024 |
|||||||
|
|
|
|
|
|
|
|
|
|
|
|
|
|
||||||
|
System-wide |
74.4 |
% |
|
(0.5 |
)% |
pts. |
|
$ |
163.78 |
|
0.2 |
% |
|
$ |
121.79 |
|
(0.5 |
)% |
|
|
|
|
|
|
|
|
|
|
|
|
|
|
||||||
|
Region |
|
|
|
|
|
|
|
|
|
|
|
|
||||||
|
U.S. |
75.8 |
% |
|
(1.0 |
)% |
pts. |
|
$ |
173.61 |
|
(0.2 |
)% |
|
$ |
131.66 |
|
(1.5 |
)% |
|
Americas (excluding U.S.) |
69.5 |
|
|
(0.5 |
) |
|
|
|
152.14 |
|
4.5 |
|
|
|
105.81 |
|
3.8 |
|
|
Europe |
77.2 |
|
|
0.8 |
|
|
|
|
177.64 |
|
0.9 |
|
|
|
137.16 |
|
2.0 |
|
|
Middle East & Africa |
70.8 |
|
|
7.2 |
|
|
|
|
189.12 |
|
(0.9 |
) |
|
|
133.85 |
|
10.3 |
|
|
Asia Pacific |
68.1 |
|
|
(0.3 |
) |
|
|
|
101.61 |
|
0.8 |
|
|
|
69.21 |
|
0.3 |
|
|
|
|
|
|
|
|
|
|
|
|
|
|
|
||||||
|
Brand(1) |
|
|
|
|
|
|
|
|
|
|
|
|
||||||
|
Waldorf Astoria Hotels & Resorts |
65.3 |
% |
|
4.5 |
% |
pts. |
|
$ |
463.61 |
|
1.3 |
% |
|
$ |
302.66 |
|
8.8 |
% |
|
Conrad Hotels & Resorts |
74.7 |
|
|
0.8 |
|
|
|
|
278.70 |
|
2.2 |
|
|
|
208.15 |
|
3.3 |
|
|
LXR Hotels & Resorts |
57.6 |
|
|
6.7 |
|
|
|
|
427.01 |
|
(2.2 |
) |
|
|
245.88 |
|
10.7 |
|
|
Canopy by Hilton |
76.9 |
|
|
1.4 |
|
|
|
|
235.36 |
|
(2.0 |
) |
|
|
181.06 |
|
(0.2 |
) |
|
Hilton Hotels & Resorts |
72.7 |
|
|
0.1 |
|
|
|
|
197.02 |
|
0.8 |
|
|
|
143.21 |
|
0.9 |
|
|
Curio Collection by Hilton |
74.8 |
|
|
2.6 |
|
|
|
|
246.87 |
|
0.4 |
|
|
|
184.56 |
|
4.0 |
|
|
DoubleTree by Hilton |
71.2 |
|
|
(0.5 |
) |
|
|
|
149.30 |
|
0.4 |
|
|
|
106.31 |
|
(0.3 |
) |
|
Tapestry Collection by Hilton |
71.5 |
|
|
(0.1 |
) |
|
|
|
193.17 |
|
1.4 |
|
|
|
138.18 |
|
1.2 |
|
|
Embassy Suites by Hilton |
77.3 |
|
|
(1.3 |
) |
|
|
|
190.51 |
|
(0.8 |
) |
|
|
147.18 |
|
(2.5 |
) |
|
Motto by Hilton |
85.6 |
|
|
2.7 |
|
|
|
|
242.38 |
|
0.3 |
|
|
|
207.58 |
|
3.5 |
|
|
Hilton Garden Inn |
73.7 |
|
|
(0.7 |
) |
|
|
|
147.50 |
|
(0.8 |
) |
|
|
108.63 |
|
(1.8 |
) |
|
Hampton by Hilton |
74.2 |
|
|
(1.1 |
) |
|
|
|
134.90 |
|
(0.5 |
) |
|
|
100.10 |
|
(1.9 |
) |
|
Tru by Hilton |
75.7 |
|
|
(0.8 |
) |
|
|
|
133.49 |
|
(1.5 |
) |
|
|
101.09 |
|
(2.5 |
) |
|
Homewood Suites by Hilton |
81.6 |
|
|
(1.0 |
) |
|
|
|
164.14 |
|
(0.6 |
) |
|
|
133.95 |
|
(1.8 |
) |
|
Home2 Suites by Hilton |
79.0 |
|
|
(1.1 |
) |
|
|
|
141.86 |
|
— |
|
|
|
112.05 |
|
(1.4 |
) |
|
|
|
|
|
|
|
|
|
|
|
|
|
|
||||||
|
Segment |
|
|
|
|
|
|
|
|
|
|
|
|
||||||
|
Management and franchise |
74.3 |
% |
|
(0.6 |
)% |
pts. |
|
$ |
162.84 |
|
0.1 |
% |
|
$ |
120.99 |
|
(0.6 |
)% |
|
Ownership(2) |
79.8 |
|
|
2.5 |
|
|
|
|
237.12 |
|
3.4 |
|
|
|
189.18 |
|
6.7 |
|
|
HILTON WORLDWIDE HOLDINGS INC. COMPARABLE AND CURRENCY NEUTRAL SYSTEM-WIDE HOTEL OPERATING STATISTICS BY REGION, BRAND AND SEGMENT (unaudited) |
||||||||||||||||||
|
|
Six Months Ended June 30, |
|||||||||||||||||
|
|
Occupancy |
|
ADR |
|
RevPAR |
|||||||||||||
|
|
2025 |
|
vs. 2024 |
|
2025 |
|
vs. 2024 |
|
2025 |
|
vs. 2024 |
|||||||
|
|
|
|
|
|
|
|
|
|
|
|
|
|
||||||
|
System-wide |
70.7 |
% |
|
— |
% |
pts. |
|
$ |
159.45 |
|
1.0 |
% |
|
$ |
112.68 |
|
1.0 |
% |
|
|
|
|
|
|
|
|
|
|
|
|
|
|
||||||
|
Region |
|
|
|
|
|
|
|
|
|
|
|
|
||||||
|
U.S. |
71.9 |
% |
|
(0.3 |
)% |
pts. |
|
$ |
169.51 |
|
0.7 |
% |
|
$ |
121.82 |
|
0.2 |
% |
|
Americas (excluding U.S.) |
67.1 |
|
|
— |
|
|
|
|
151.63 |
|
5.9 |
|
|
|
101.80 |
|
6.0 |
|
|
Europe |
70.9 |
|
|
0.8 |
|
|
|
|
159.54 |
|
1.4 |
|
|
|
113.13 |
|
2.5 |
|
|
Middle East & Africa |
70.5 |
|
|
4.8 |
|
|
|
|
198.08 |
|
2.1 |
|
|
|
139.69 |
|
9.5 |
|
|
Asia Pacific |
66.2 |
|
|
0.3 |
|
|
|
|
102.52 |
|
— |
|
|
|
67.84 |
|
0.4 |
|
|
|
|
|
|
|
|
|
|
|
|
|
|
|
||||||
|
Brand(1) |
|
|
|
|
|
|
|
|
|
|
|
|
||||||
|
Waldorf Astoria Hotels & Resorts |
64.4 |
% |
|
4.6 |
% |
pts. |
|
$ |
477.45 |
|
4.3 |
% |
|
$ |
307.64 |
|
12.3 |
% |
|
Conrad Hotels & Resorts |
73.5 |
|
|
1.6 |
|
|
|
|
279.39 |
|
2.2 |
|
|
|
205.48 |
|
4.5 |
|
|
LXR Hotels & Resorts |
52.8 |
|
|
4.1 |
|
|
|
|
406.50 |
|
(0.3 |
) |
|
|
214.76 |
|
8.1 |
|
|
Canopy by Hilton |
72.5 |
|
|
2.3 |
|
|
|
|
225.84 |
|
(0.3 |
) |
|
|
163.69 |
|
3.0 |
|
|
Hilton Hotels & Resorts |
69.5 |
|
|
0.5 |
|
|
|
|
193.40 |
|
1.5 |
|
|
|
134.46 |
|
2.2 |
|
|
Curio Collection by Hilton |
71.6 |
|
|
3.0 |
|
|
|
|
240.22 |
|
0.7 |
|
|
|
171.91 |
|
5.1 |
|
|
DoubleTree by Hilton |
67.5 |
|
|
(0.1 |
) |
|
|
|
144.86 |
|
1.0 |
|
|
|
97.84 |
|
0.8 |
|
|
Tapestry Collection by Hilton |
66.8 |
|
|
0.7 |
|
|
|
|
184.06 |
|
1.7 |
|
|
|
122.88 |
|
2.7 |
|
|
Embassy Suites by Hilton |
74.0 |
|
|
(0.8 |
) |
|
|
|
187.12 |
|
0.4 |
|
|
|
138.55 |
|
(0.7 |
) |
|
Motto by Hilton |
81.2 |
|
|
3.4 |
|
|
|
|
207.32 |
|
1.4 |
|
|
|
168.44 |
|
5.8 |
|
|
Hilton Garden Inn |
69.5 |
|
|
— |
|
|
|
|
142.18 |
|
(0.1 |
) |
|
|
98.85 |
|
(0.1 |
) |
|
Hampton by Hilton |
69.9 |
|
|
(0.6 |
) |
|
|
|
129.76 |
|
0.1 |
|
|
|
90.68 |
|
(0.7 |
) |
|
Tru by Hilton |
71.4 |
|
|
— |
|
|
|
|
128.60 |
|
(0.5 |
) |
|
|
91.78 |
|
(0.5 |
) |
|
Homewood Suites by Hilton |
78.5 |
|
|
(0.4 |
) |
|
|
|
158.69 |
|
— |
|
|
|
124.64 |
|
(0.4 |
) |
|
Home2 Suites by Hilton |
76.0 |
|
|
(0.3 |
) |
|
|
|
138.07 |
|
0.7 |
|
|
|
104.88 |
|
0.3 |
|
|
|
|
|
|
|
|
|
|
|
|
|
|
|
||||||
|
Segment |
|
|
|
|
|
|
|
|
|
|
|
|
||||||
|
Management and franchise |
70.6 |
% |
|
— |
% |
pts. |
|
$ |
158.72 |
|
0.9 |
% |
|
$ |
112.11 |
|
0.9 |
% |
|
Ownership(2) |
73.7 |
|
|
1.5 |
|
|
|
|
218.96 |
|
3.5 |
|
|
|
161.47 |
|
5.7 |
|
|
____________ |
|
|
(1) |
Excludes brands for which a significant number of the hotels were designated as non-comparable hotels as of the end of the period so as to make comparative statistics for such brand not meaningful. |
|
(2) |
Includes hotels owned or leased by entities in which we own a noncontrolling financial interest. |
|
HILTON WORLDWIDE HOLDINGS INC. PROPERTY SUMMARY As of June 30, 2025 |
|||||||||||||||
|
|
Ownership(1) |
|
Managed |
|
Franchised / Licensed |
|
Total |
||||||||
|
|
Properties |
|
Rooms |
|
Properties |
|
Rooms |
|
Properties |
|
Rooms |
|
Properties |
|
Rooms |
|
Waldorf Astoria Hotels & Resorts |
2 |
|
463 |
|
34 |
|
8,759 |
|
— |
|
— |
|
36 |
|
9,222 |
|
Conrad Hotels & Resorts |
1 |
|
164 |
|
43 |
|
13,990 |
|
4 |
|
2,496 |
|
48 |
|
16,650 |
|
LXR Hotels & Resorts |
— |
|
— |
|
7 |
|
1,155 |
|
9 |
|
1,584 |
|
16 |
|
2,739 |
|
NoMad |
— |
|
— |
|
1 |
|
91 |
|
— |
|
— |
|
1 |
|
91 |
|
Signia by Hilton |
— |
|
— |
|
4 |
|
2,797 |
|
— |
|
— |
|
4 |
|
2,797 |
|
Canopy by Hilton |
— |
|
— |
|
12 |
|
2,033 |
|
33 |
|
5,912 |
|
45 |
|
7,945 |
|
Hilton Hotels & Resorts |
43 |
|
14,660 |
|
302 |
|
128,490 |
|
267 |
|
81,688 |
|
612 |
|
224,838 |
|
Curio Collection by Hilton |
— |
|
— |
|
27 |
|
6,526 |
|
157 |
|
28,482 |
|
184 |
|
35,008 |
|
Graduate by Hilton |
— |
|
— |
|
— |
|
— |
|
35 |
|
5,883 |
|
35 |
|
5,883 |
|
DoubleTree by Hilton |
— |
|
— |
|
168 |
|
45,275 |
|
539 |
|
112,998 |
|
707 |
|
158,273 |
|
Tapestry Collection by Hilton |
— |
|
— |
|
5 |
|
690 |
|
168 |
|
19,539 |
|
173 |
|
20,229 |
|
Embassy Suites by Hilton |
— |
|
— |
|
39 |
|
10,309 |
|
230 |
|
51,760 |
|
269 |
|
62,069 |
|
Tempo by Hilton |
— |
|
— |
|
1 |
|
661 |
|
3 |
|
563 |
|
4 |
|
1,224 |
|
Motto by Hilton |
— |
|
— |
|
— |
|
— |
|
8 |
|
1,727 |
|
8 |
|
1,727 |
|
Hilton Garden Inn |
— |
|
— |
|
127 |
|
24,975 |
|
960 |
|
135,552 |
|
1,087 |
|
160,527 |
|
Hampton by Hilton |
— |
|
— |
|
53 |
|
8,550 |
|
3,085 |
|
343,653 |
|
3,138 |
|
352,203 |
|
Tru by Hilton |
— |
|
— |
|
14 |
|
1,565 |
|
304 |
|
29,525 |
|
318 |
|
31,090 |
|
Spark by Hilton |
— |
|
— |
|
— |
|
— |
|
172 |
|
15,220 |
|
172 |
|
15,220 |
|
Homewood Suites by Hilton |
— |
|
— |
|
8 |
|
1,020 |
|
540 |
|
61,950 |
|
548 |
|
62,970 |
|
Home2 Suites by Hilton |
— |
|
— |
|
2 |
|
210 |
|
811 |
|
88,654 |
|
813 |
|
88,864 |
|
Strategic partner hotels(2) |
— |
|
— |
|
— |
|
— |
|
467 |
|
22,251 |
|
467 |
|
22,251 |
|
Other(3) |
— |
|
— |
|
3 |
|
1,087 |
|
14 |
|
3,542 |
|
17 |
|
4,629 |
|
Total hotels |
46 |
|
15,287 |
|
850 |
|
258,183 |
|
7,806 |
|
1,012,979 |
|
8,702 |
|
1,286,449 |
|
Hilton Grand Vacations(4) |
— |
|
— |
|
— |
|
— |
|
105 |
|
18,430 |
|
105 |
|
18,430 |
|
Total system |
46 |
|
15,287 |
|
850 |
|
258,183 |
|
7,911 |
|
1,031,409 |
|
8,807 |
|
1,304,879 |
|
|
|
|
|
|
|
|
|
|
|
|
|
|
|
|
|
|
|
|
|
|
|
|
|
|
|
|
|
|
|
|
|
|
|
|
|
|
|
|
|
|
|
|
|
|
|
|
|
|
|
|
|
Ownership(1) |
|
Managed |
|
Franchised / Licensed |
|
Total |
||||||||
|
|
Properties |
|
Rooms |
|
Properties |
|
Rooms |
|
Properties |
|
Rooms |
|
Properties |
|
Rooms |
|
U.S. |
— |
|
— |
|
182 |
|
79,589 |
|
5,879 |
|
754,557 |
|
6,061 |
|
834,146 |
|
Americas (excluding U.S.) |
1 |
|
405 |
|
71 |
|
18,378 |
|
411 |
|
54,045 |
|
483 |
|
72,828 |
|
Europe |
37 |
|
10,662 |
|
111 |
|
28,184 |
|
708 |
|
87,267 |
|
856 |
|
126,113 |
|
Middle East & Africa |
3 |
|
1,376 |
|
111 |
|
30,611 |
|
37 |
|
5,749 |
|
151 |
|
37,736 |
|
Asia Pacific |
5 |
|
2,844 |
|
375 |
|
101,421 |
|
771 |
|
111,361 |
|
1,151 |
|
215,626 |
|
Total hotels |
46 |
|
15,287 |
|
850 |
|
258,183 |
|
7,806 |
|
1,012,979 |
|
8,702 |
|
1,286,449 |
|
Hilton Grand Vacations(4) |
— |
|
— |
|
— |
|
— |
|
105 |
|
18,430 |
|
105 |
|
18,430 |
|
Total system |
46 |
|
15,287 |
|
850 |
|
258,183 |
|
7,911 |
|
1,031,409 |
|
8,807 |
|
1,304,879 |
Contacts
Investor Contact
Jill Chapman
+1 703 883 1000
Media Contact
Kent Landers
+1 703 883 3246