Popular Bank’s commercial real estate approach has zeroed in on two distinct lending options: bridge lending and construction financing. The bank’s team helps clients, including local developers and investors, understand which option to use and when, helping them unlock opportunities in one of the nation’s hottest markets.
Bridge Lending: a phased approach to financing construction projects
The bridge lending market has transformed dramatically in recent months. Less than two years ago, the rates were in double digits. The rate has since dropped below 10%, making bridge lending a more attractive and accessible capital option for borrowers.
For developers pursuing repositioning or stabilization plays, bridge loans present a window of opportunity. For some clients, a phased approach tied to specific project deliverables makes the most sense. A few weeks ago, Popular Bank closed a $10 Million bridge loan to help finalize renovations and lease-up of a 71-unit multifamily building in the Little Havana neighborhood of Miami. Working closely with the client, the bank defined each stage of the project, outlining what needed to be completed to activate the next funding found. Access to multi-phased short-term capital kept the project momentum going while mitigating the risks of larger financing loans. It was the right approach for the project and it is currently in phase two of funding their project.
Construction Lending: financing ground-up projects from blueprint to occupancy
For developers considering a construction loan, it is important to keep a few things top of mind. Unlike shorter-phased bridge loans, capacity in construction lending has tightened. Lenders and developers alike are looking at project feasibility before breaking ground. Regulatory pressures, higher costs of labor and materials, concentration limits, and sector-specific stress have made lenders far more selective, particularly for speculative builds.
And while Miami’s market fundamentals remain strong, they can vary by property type. Multifamily faces short-term pressure with more than 32,000 units under construction, about 24% of existing supply. Industrial vacancy has risen to 6.2% following record deliveries. Retail continues to perform well with sub-4% vacancy and limited new inventory.
For condominium developers, lender expectations have increased as well, often requiring significant pre-sale levels before a construction loan closes. These higher thresholds help ensure projects demonstrate true market demand in a segment where sales velocity varies widely by location and product type. Popular Bank recently helped finance a ground-up construction of a 312-unit multifamily located in the Naranja neighborhood of Miami-Dade with a $32.4 Million loan.
Miami remains one of the most dynamic commercial real estate markets in the nation, with tens of thousands of jobs added in the past two years alone. The opportunity is here and lenders like Popular Bank remain eager to deploy capital for well-positioned projects that make our city vibrant and enjoyable for everyone.
The projection reflects a gradual slowdown compared to the region’s 2.2% growth in 2025.
According to “Resilience and Growth Prospects in a Shifting Global Economy,” labor markets in the region have sustained low unemployment, inflation has been largely contained, and investor confidence has improved, as reflected in historically low borrowing costs, with the median sovereign spread falling to 209 basis points at the end of 2025, down from 268 in 2019.
Despite these gains, growth remains insufficient to close income gaps, public-debt levels are high, and higher interest payments are placing increasing pressure on public finances and external accounts.
“Latin America and the Caribbean navigated global uncertainty with resilience, supported by fiscal and monetary frameworks that have helped contain inflation and sustain macroeconomic stability,” said Laura Alfaro Maykall, IDB chief economist and economic counselor. “Looking ahead, countries have to accelerate productivity-led growth, strengthen public finances, and seize new opportunities from digitalization, artificial intelligence, and the energy to raise living standards and build more resilient and inclusive economies.”
Opportunities in critical minerals
The region is uniquely positioned to turn rapid technological advances and global energy needs into engines of growth, the report underscores. Both trends rely heavily on critical minerals, which the region holds in abundance. A striking example is lithium; global demand is projected to rise between 470% and 800% by 2050. With roughly half of global lithium resources, about 35% of global copper reserves, and more than 20% of rare-earth reserves, the region is well positioned to become a strategic supplier in the value chains of the future.
The report cautions, however, that natural wealth does not guarantee lasting development. Capturing the opportunity in critical minerals will require stronger institutions, predictable rules, diverse and reliable energy, robust environmental governance, and disciplined fiscal frameworks.
Improvement in labor market conditions
Labor-market conditions improved markedly in 2025, with unemployment rates falling in most countries between June 2024 and June 2025, and joblessness nearing its lowest levels in recent years. While women’s participation in the labor force has surged, growth remains constrained by modest productivity gains and demographic shifts that are slowing the expansion of the working-age population.
As a result, sustaining growth will increasingly depend on productivity gains and upgrading skills. Expanding access to digital training and supporting workers’ transitions into higher-productivity occupations will be essential as labor markets evolve. The report highlights skills related to artificial intelligence as the fastest-growing in the region, with job postings referencing AI rising sharply by mid-2025, to 7% of total vacancies.
Fiscal policy is entering a challenging phase, requiring urgent strengthening of fundamentals. Public debt remains above pre-2020 benchmarks, interest payments are rising, and fiscal consolidation has weakened. Average public debt in the region stands at 59% of GDP, with projections ranging between 57% and 66% of GDP by 2028 under baseline and stress scenarios. Among policy actions, the report highlights the potential of digitalization to boost tax collection when paired with credible enforcement strategies.
While inflation has largely returned to target across much of the region, higher global interest rates, shifting expectations, and the growing use of digital and foreign-currency assets are reshaping the monetary-policy landscape. The report emphasizes the importance of reaching a neutral monetary stance — neither stimulating nor restraining economic activity — while developing flexible tools to absorb external shocks.
The report concludes that policies promoting stronger competition, improved skills formation, deeper regional integration, and the development of more sophisticated regional value chains can significantly boost productivity — and should remain at the center of Latin America and the Caribbean’s policy agendas.
About the IDB
The Inter-American Development Bank (IDB), a member of the IDB Group, is devoted to improving lives across Latin America and the Caribbean. Founded in 1959, the Bank works with the region’s public sector to design and enable impactful, innovative solutions for sustainable and inclusive development. Leveraging financing, technical expertise, and knowledge, it promotes growth and well-being in 26 countries. Visit our website: https://www.iadb.org/en.
]]>
As part of the office of the CFO, the AP function is tasked with managing these liabilities. It plays a strategic role in optimizing working capital, preserving vendor relationships and enabling efficient financial reporting.
Below, we walk through the accounts payable process, key performance metrics, job roles, best practices, and how AP automation is rapidly transforming the function.
What Is Accounts Payable? Meaning, Definition & Importance
As an accounting term, accounts payable (AP) refers to the cumulative amount a company owes to suppliers or service providers for goods or services purchased on credit. When referring to a company’s obligations or ability to pay, the term AP is often used interchangeably with terms like payables, bills payable or payability.
AP is recorded as a current liability on the balance sheet and reflects short-term obligations that are typically due within 30 to 90 days. Importantly, AP is not an expense account but a liability account, signifying the company’s responsibility to settle these dues.
Beyond the balance sheet, AP also refers to the department or function responsible for managing these liabilities. Typically part of the broader finance organization, AP is responsible for ensuring that all outstanding invoices are tracked, verified, approved, and paid accurately and on time.
Effective AP management ensures a balance between outgoing cash flow and operational needs. Businesses that delay payment beyond terms may damage relationships and face late fees, while those that pay accurately and on time preserve vendor trust, which can open the door to favorable terms or early-payment discounts. However, businesses that pay too quickly may miss the opportunity to hold cash longer for liquidity or interest. In short, accounts payable is a key lever in maintaining financial health.
Accounts Payable vs. Accounts Receivable
Accounts payable (AP) and accounts receivable (AR) represent opposite sides of a transaction:
- AP involves money a company owes to external vendors, making it a liability.
- AR represents money owed to the company by its customers and is classified as an asset.
For example, when Company A purchases equipment on credit from Company B, A records the transaction under AP while B records it under AR.
This distinction between AP and AR impacts cash flow management and overall financial planning. AP focuses on extending payments within agreed terms to conserve cash, while AR focuses on collecting payments quickly to bring cash in. In some small or mid-sized companies, the same staff may handle accounts payable and receivable, but the skill sets and goals differ.
Accounts Payable Process (Procure-to-Pay)
The AP process, often referred to as procure-to-pay, is a structured workflow that governs how a company purchases and pays for goods or services. The process begins with a purchase requisition, which leads to a formal purchase order (PO) being issued to a supplier. Upon receipt of goods or services, the supplier sends an invoice, which is reviewed and compared to the PO and delivery documentation in a three-way match.
Once approved, the invoice is entered into the accounting system by debiting an expense or asset account and crediting AP. The payable is scheduled for payment according to the supplier’s terms. After payment is made, AP is debited, and cash is credited. Finally, reconciliation and reporting ensure that all invoices are accounted for, and payments are properly tracked.
Recurring transactions, such as electricity bills and outstanding salary journal entries, are also processed through AP. Companies may use default purchase accounts in their enterprise resource planning (ERP) systems to categorize these transactions automatically.
AP Journal Entries & Examples
Recording AP transactions accurately is critical in double-entry accounting systems. When a company incurs payment, the accounting system credits AP and debits the relevant expense or asset account. For instance, if a business receives a $780 invoice for office supplies:
- Debit: Office Supplies Expense $780
- Credit: Accounts Payable $780
Once the invoice is paid:
- Debit: Accounts Payable $780
- Credit: Cash $780
This illustrates that AP is a credit, as it increases liability. When the company settles the obligation, AP is debited, reducing the balance, and cash is credited to reflect the outflow. Common terms such as bills payable, payable amount or sum of AP refer to the total short-term liabilities a company has at a given point. The purchase account is a default used in many systems to allocate invoice amounts based on vendor or expense type. Accounting teams must ensure the accuracy of these entries to maintain compliance and financial transparency.
Key AP Metrics: Turnover Ratio & Days Payable Outstanding (DPO)
Two essential metrics help evaluate the efficiency of a company’s AP process: the AP turnover ratio and days payable outstanding (DPO).
The AP turnover ratio is calculated as:
Accounts Payable Turnover = Net Credit Purchases ÷ Average Accounts Payable
This ratio measures how frequently a company pays off its AP during a period. A higher ratio suggests faster payment cycles, while a lower ratio may indicate delayed payments or strained liquidity. However, extremely high turnover may also suggest the company is not fully utilizing its available credit terms.
DPO shows the average number of days a company takes to pay suppliers:
DPO = (Average Accounts Payable ÷ Cost of Goods Sold) x 365
Monitoring DPO helps companies find the right balance between conserving cash and maintaining strong supplier relationships. To better understand how payment strategies and timing affect DPO and working capital, refer to the AFP Payments Guide to Making a Business Case for Real-Time Payments, underwritten by MUFG.
AP Roles, Careers & Skills
The AP function includes a few roles, each with unique responsibilities, as outlined in our example accounts payable job descriptions:
- AP clerks are responsible for invoice data entry, verifying accuracy, coding expenses and scheduling and processing payments.
- AP specialists process invoices, reconcile statements, ensure timely payments to vendors and maintain strong relationships with vendors and internal stakeholders.
- AP managers oversee all AP transactions within the organization, supervise a team of AP professionals, ensure compliance with company policies and procedures, maintain strong relationships with vendors and internal stakeholders and drive process improvements.
To succeed in these roles, AP professionals need attention to detail, knowledge of accounting principles, proficiency in ERP systems and strong communication skills. Career advancement opportunities are growing as automation shifts AP from data entry toward analytical and strategic responsibilities. For professionals managing accounts payable and receivable, cross-functional expertise can enhance career mobility.
The median total annual compensation for AP professionals varies by job title, from $52,500 for AP clerks to $90,000 for AP managers. More detailed salary information for AP professionals can be found in the AFP Enterprise Payments Salary Guide, which draws from the annual AFP Compensation and Benefits Survey.
Best Practices & Internal Controls for AP
To manage AP effectively, organizations must implement strong internal controls and follow industry best practices. First, ensure segregation of duties: invoice approval, payment authorization and vendor setup should involve different team members. Apply the three-way match to verify invoice amounts, PO details and delivery receipts before payment.
Timely payments reduce late fees and may unlock early payment discounts such as 2/10 Net 30. Companies should monitor DPO to manage cash flow while maintaining good supplier relationships. Digital workflows reduce human error and accelerate invoice processing. For detailed AP strategies, read AFP’s article on overcoming check challenges for AP and AR and our guide to Making a Business Case for Real-Time Payments, underwritten by MUFG.
AP Automation & Technology Trends
Organizations are rapidly adopting AP automation to improve efficiency and accuracy. Technologies such as optical character recognition (OCR), intelligent data capture and workflow software now handle invoice routing, approvals and even payment execution. AP automation enables remote access, reduces processing time and provides real-time visibility into liabilities and cash needs.
Emerging tools include AI for anomaly detection, machine learning for invoice categorization and blockchain for secure, transparent payments. Supplier portals improve collaboration by allowing vendors to check payment status online. Sustainability goals also drive the adoption of paperless invoicing.
To explore technological advancements for AP further, read our guide to automating accounts payable and visit the AFP Treasury and Finance Marketplace to evaluate leading AP software providers.
Conclusion: Modernizing AP for Strategic Impact
Accounts payable is no longer simply a back-office task; it’s a strategic contributor to financial success. By managing payables effectively, companies can optimize cash flow, capture savings, reduce risk and enhance supplier relationships. Understanding the accounts payable process, implementing best practices, tracking performance and embracing automation are all vital steps in this transformation.
As AP teams move toward automation and real-time analytics, their work increasingly supports cross-functional goals in treasury, procurement and financial planning. To support your AP evolution, explore AFP’s comprehensive training materials and the AFP Treasury and Finance Marketplace for tools that can help modernize your payable operations.
]]>
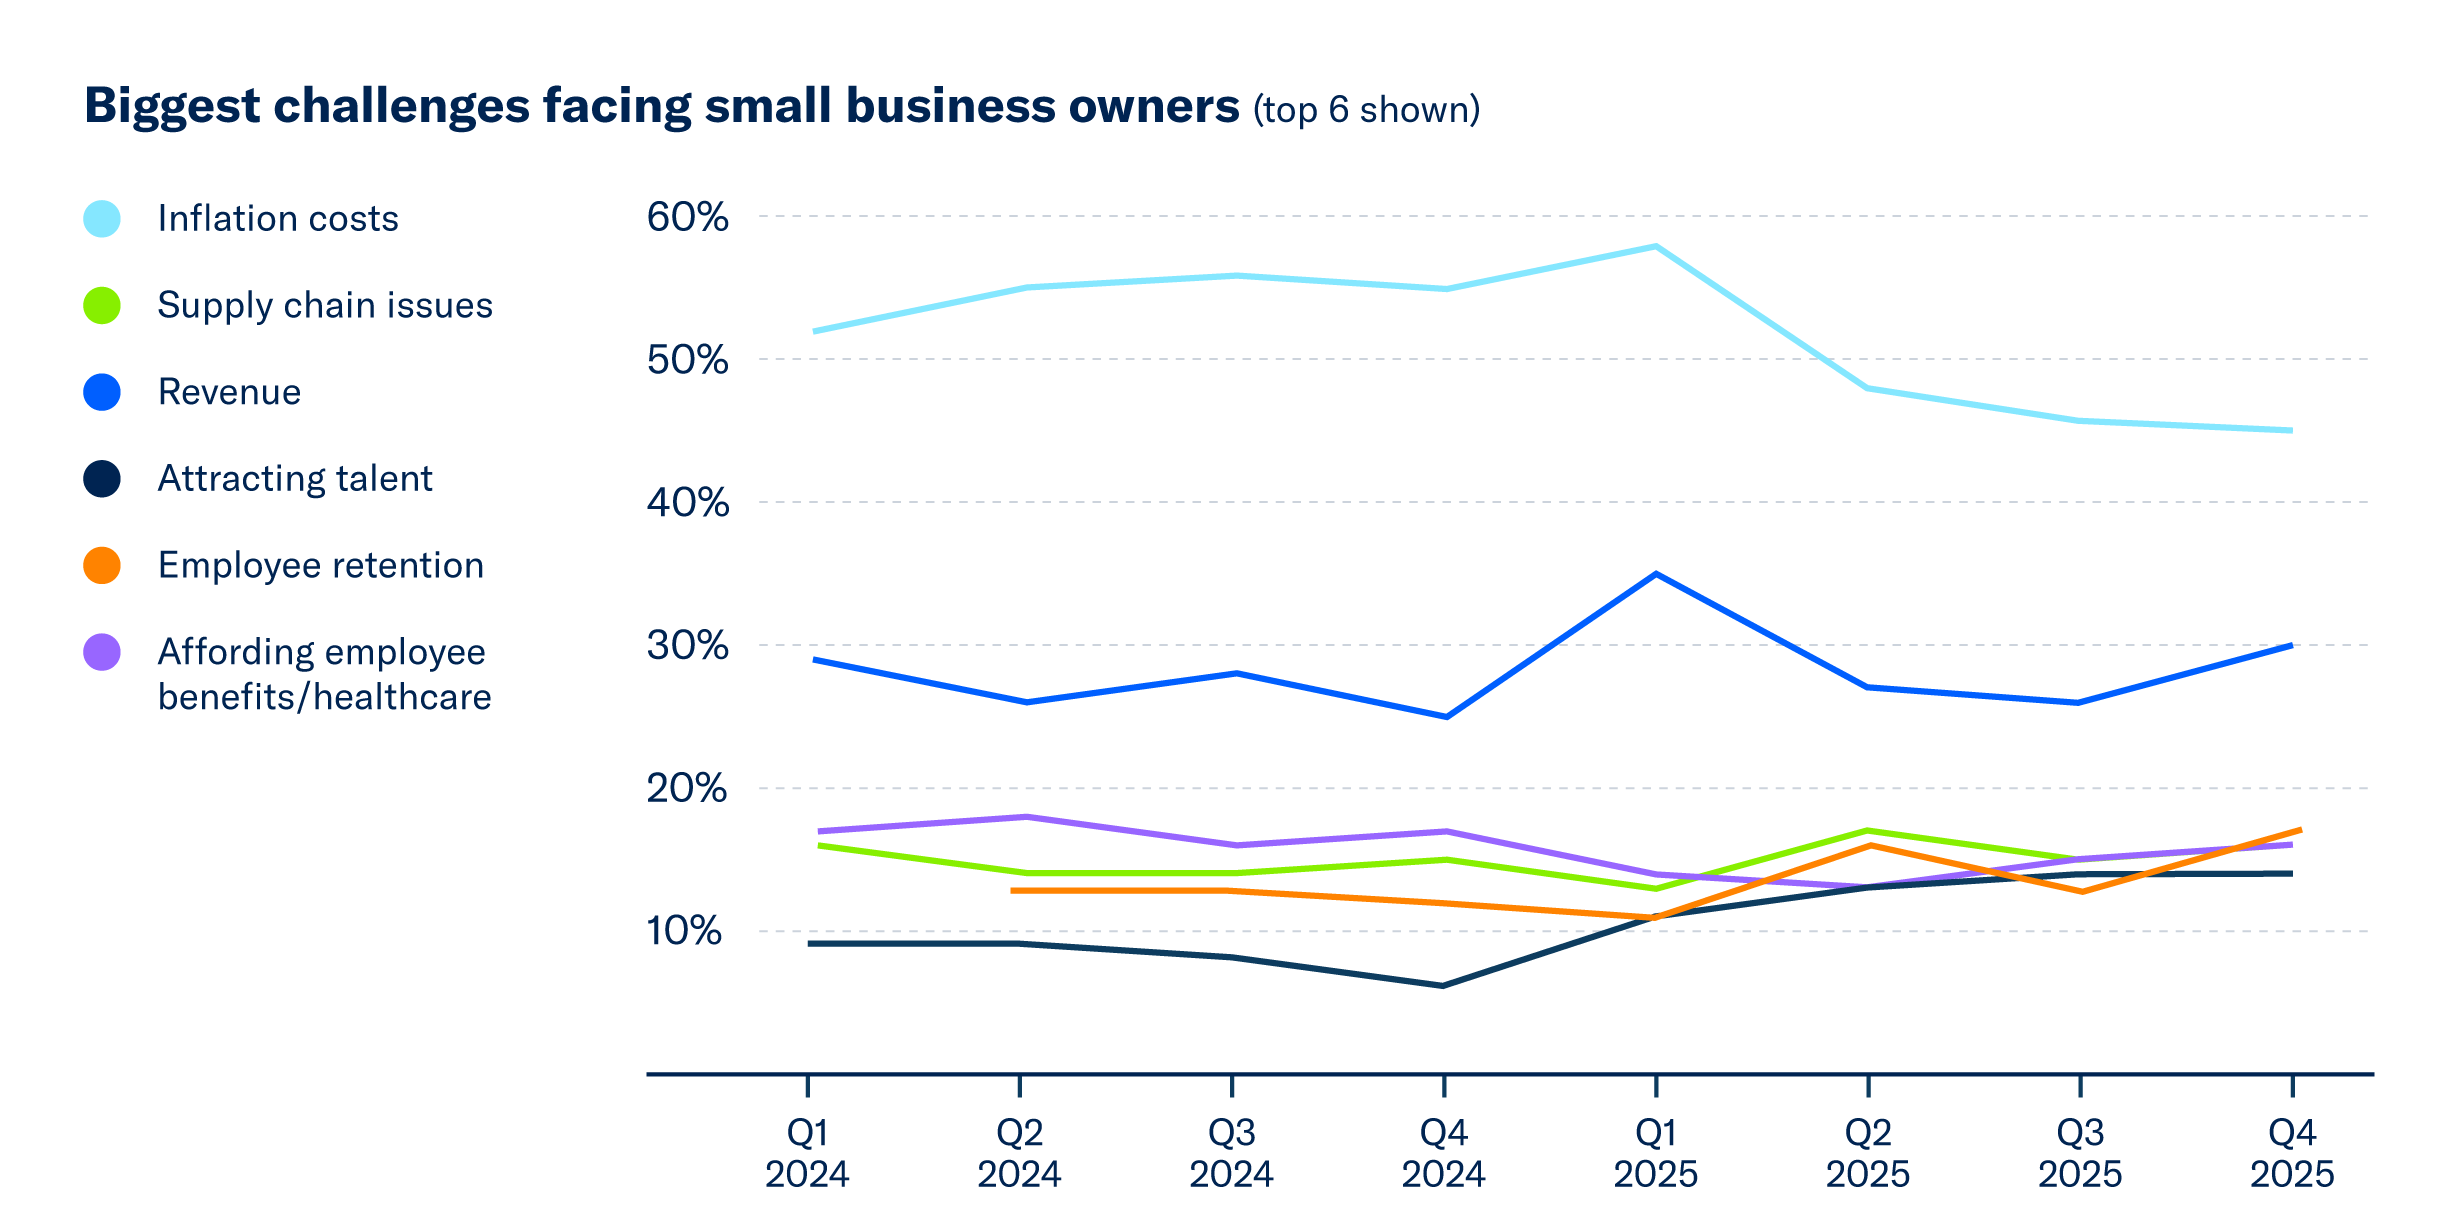
The latest MetLife & U.S. Chamber of Commerce Small Business Index shows that employers’ concerns about recruiting and retaining workers have been rising over the past year.
The survey also shows that inflation is stubbornly lingering as the top concern for small businesses, despite receding slightly from record highs.
This quarter, the Index shows that small businesses’ concern about their ability to retain employees (17%) and attract talent (14%) is rising. Roughly one in four (26%) small business owners select one of these “talent” items as their top concern.
Concerns Over Talent Rise
Concerns over attracting talent has risen eight percentage points compared to this time last year (was 6% in Q4 2024). Similarly, retaining employees has risen five percentage points over the same time period (was 12% in Q4 2024).
“This quarter’s Index makes it clear: attracting and retaining employees is a growing concern for today’s small businesses,” said Bradd Chignoli, executive vice president and head of Regional Business & Workforce Engagement at MetLife.
Notably, the percentage of small businesses that selected either retaining employees or attracting talent has risen from 16% in Q4 2024 to 26% this quarter. [1]
[1]In Q4 2024, this option was asked as “Lack of applicants for job openings”.
Lower levels of concern about talent also existed three years ago. In Q4 2022, 11% of small businesses considered employee retention a top concern and just 8% said attracting talent was a top concern.
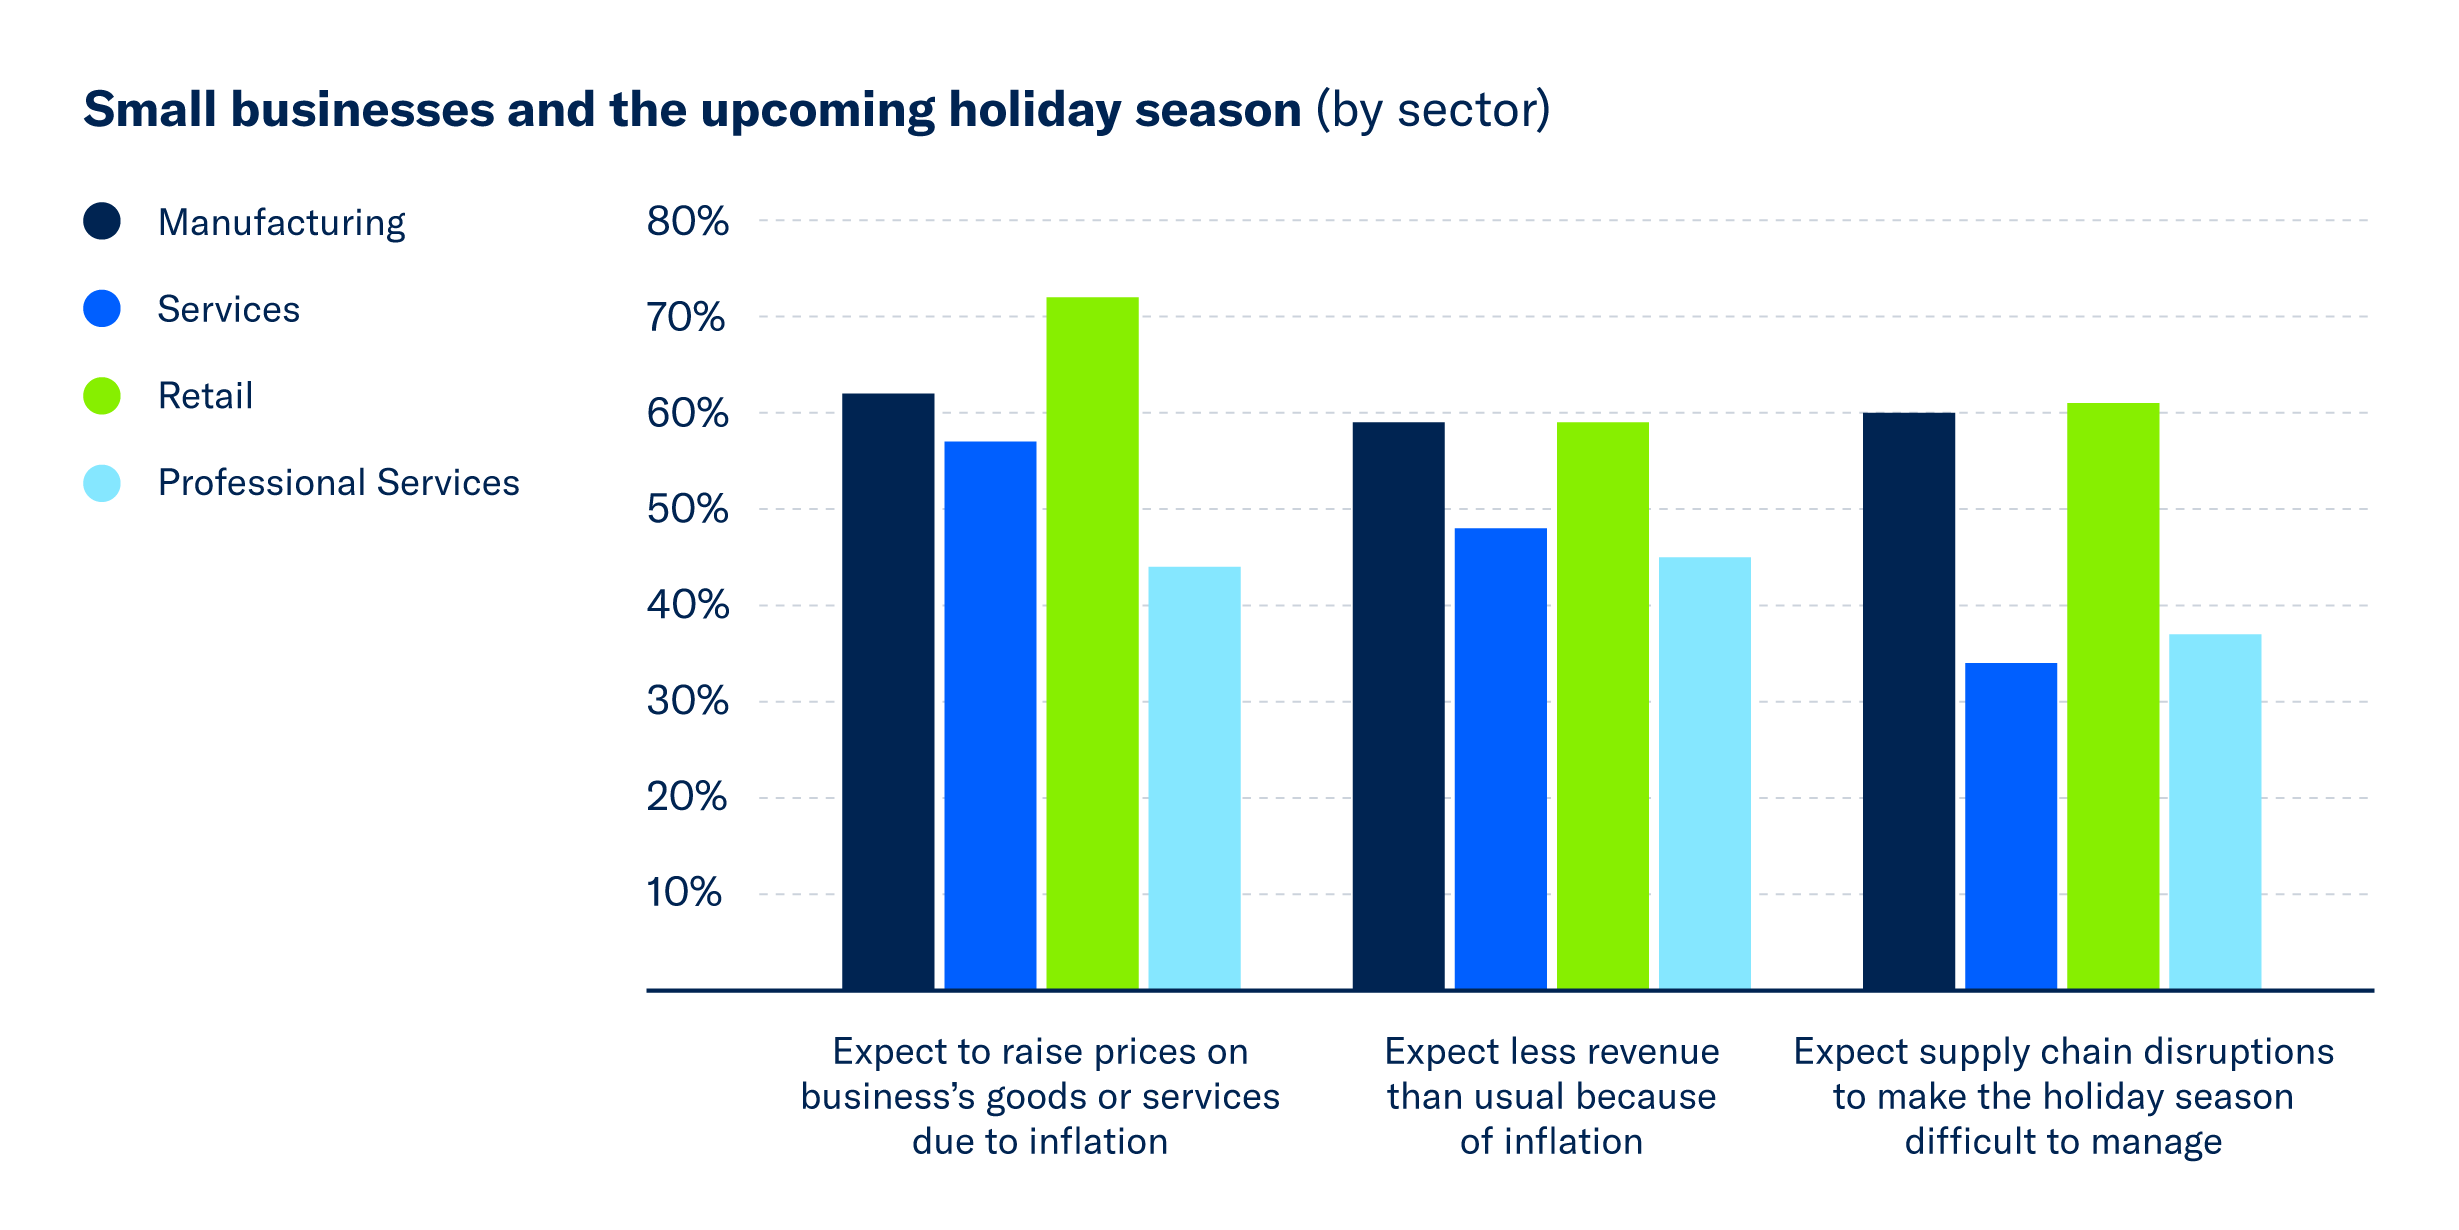
Inflation Concerns Small Retailers Most
This quarter’s survey also shows that inflation remains the top concern among small business owners: 45% say it is the biggest challenge they face right now. However, concern has remained below the 50% threshold for a third consecutive quarter and is on par with Q2 2022 (44%).
“Inflation remains the top challenge, and workforce concerns are rising,” said Tom Sullivan, Senior Vice President of Small Business Policy at the U.S. Chamber of Commerce. “Yet, small businesses are showing resilience, even amid uncertainty exacerbated by the longest government shutdown in history, when this survey was in the field.”
But all sectors are not equal when it comes to inflation concerns. In fact, small retailers are the most worried about inflation with 53% saying it’s a top concern. Manufacturers are least concerned about inflation (38% said it was a top concern). In the middle: 46% in the services industry and 42% in professional services said inflation is their top concern.
Small businesses also report that inflation is impacting their holiday plans. Over half (58%) expect to raise prices, and 52% anticipate lower revenue due to inflation.
Minority-owned businesses (55%) and small businesses with 20-500 employees (53%) also express higher levels of concern over inflation. Smaller small businesses are less concerned about inflation: Both 44% of medium (5-19 employees) and the smallest small businesses (1-4 employees) cite inflation as a top concern.
Similarly, concerns about revenue saw a slight uptick this quarter from 26% to 30% and remain relatively high. Revenue concerns now sit at the second highest level since 2021, only beat by Q1 2025 (35%).
]]>
If you’ve ever wondered how public financial management (PFM) systems integrate gender considerations so that public funds benefit everyone more equally, we’re going to share with you what we’ve learned from our latest data. Since 2020, 32 national and subnational governments have applied the Public Expenditure & Financial Accountability (PEFA) Gender Framework, creating the first global dataset on how PFM systems address gender issues. The results show progress and increased commitment but also highlight remaining gaps in achieving gender‑equality outcomes.
These 32 assessments provide a baseline for understanding where PFM systems stand today, identifying gaps, and how governments could become more gender‑responsive. PEFA Gender benchmarks good practices and informs dialogue between ministries of finance, agencies, and development partners
A global overview: Most systems are at an early stage
Across the board, most governments are still at the beginning. Only a few have embedded gender requirements into core PFM tools such as budget circulars or annual reporting frameworks. One global weakness jumps out: analyzing the gender impact of new policies. This isn’t just a PEFA finding—it lines up with broader trends. For example, OECD data shows that fewer than half of OECD countries routinely conduct gender impact assessments before rolling out new policies. The IMF’s reviews of G20 economies find advanced gender practices in only a handful of countries like Canada, Austria, France, and Japan.
Where countries are making progress
Despite the gaps, there are signs of real progress:
- Budget circulars are gaining ground: Nine countries now include gender requirements in their budget call circulars. While circulars do not guarantee implementation, they set the stage for ministries to begin factoring gender into budget planning.
- Sex-disaggregated performance data is becoming common: More than half of the assessed governments now collect or publish sex-disaggregated data related to service delivery. This mirrors priorities among OECD members, who see robust gender data as the first step toward effective GRB.
- Expenditure tracking is emerging: Though only a few governments have tagging or classification gender-related spending, this practice is expanding. The IMF research highlights gender-budget tagging as key for medium-term planning and accountability.
Where key gaps persist
One major gap is gender impact assessment. Understanding how a policy affects men and women differently is crucial for credible GRB systems, but this was assessed as weak for most governments. Another area lagging behind is legislative scrutiny of gender impacts—almost all assessments gave low scores for both budget and audit review. Without this, reforms risk remaining technical exercises instead of driving real change in allocations and outcomes.
Three lessons emerge
- Progress is happening “from the middle”: Tools such as budget circulars and performance data are advancing faster than upstream policy analysis.
- Central guidance matters: When ministries of finance integrate gender requirements into core processes, other aspects of gender-responsive PFM strengthen too.
- Data is outpacing decision-making: Sex-disaggregated information is increasingly available, but it’s not yet consistently used to shape policy or allocate resources.
What these findings mean for the future
With these first-generation assessments, we now have a global baseline: countries are committed to integrating gender into the budget cycle, but most are still early in building institutional frameworks.
Going forward, three areas offer potential promise:
1. Strengthening upstream gender analysis
2. Enhancing legislative engagement
3. Embedding gender-responsive budgeting into mainstream PFM reforms
PEFA Gender will continue to be a vital lens, helping governments and development partners track progress, set priorities, and build stronger gender‑responsive public financial management systems over time.
We’ll keep sharing updates as new data emerges. It’s clear—we’re on the path, but there’s plenty of work ahead!
]]>
The recently enacted “One Big Beautiful Bill Act” includes substantial tax reforms to support the growth of small businesses. Small business owners can take advantage of these tax breaks starting now for expenses dating back to January 20, 2025.
This guide outlines the most impactful provisions of the law, including permanent deductions, enhanced credits, and expanded eligibility criteria. It provides clear, step-by-step instructions to help business owners navigate the changes and optimize their tax strategies. Download the guide or read below to learn more.
1. Permanently Claim the 20% Qualified Business Income (QBI) Deduction
Who qualifies: Sole proprietors, partners, and S corporation shareholders.
What to do:
- Calculate your qualified business income (QBI) for the year.
- Deduct 20% of your QBI on your federal tax return every year—this deduction is now permanent.
- If your QBI deduction is low, check your eligibility for the new inflation-adjusted minimum deduction (at least $400).
- If you were previously ineligible for the deduction, determine whether changes to the phase-in of existing limitations make your business eligible.
Action item:
Work with your accountant or tax professional to determine your eligibility and claim the maximum deduction each year.
2. Immediately Deduct Qualifying Research & Experimental (R&E) Expenses
Who qualifies: Businesses with domestic R&E spending, especially those with average annual gross receipts of $31 million or less.
What to do:
- Track your U.S.-based R&E expenses each year.
- Deduct 100% of your qualifying R&E expenses this year on your 2025 tax return.
- If your annual gross receipts average $31 million or less, you may apply this benefit retroactively for tax years 2022–2024.
Action item:
Review past returns with your tax professional to seek retroactive refunds if eligible.
]]>U.S. Bank, a leading provider of payment services and solutions, today announced a new business credit card designed to help small business owners navigate fluctuations in finances and resources: the .

This new business credit card offers a for 18 billing cycles when applying at and 12 billing cycles when applying in – all with . Plus, cardholders can enjoy a suite of benefits to help navigate the foreseen – and the unforeseen- needs of their small business.
“The Business Shield Visa card is designed to help business owners navigate the unpredictable financial and resource challenges that come with running a small business,” said Anthony Merola, head of Bank Brand and Small Business Cards at U.S. Bank. “Featuring an industry-leading 0% extended introductory APR on purchases and balance transfers and access to Spend Management, our expense management platform, this card is a transformative solution for both new and seasoned business owners looking to safeguard their business from the unexpected.”
With , part of the comprehensive suite of business solutions that is earning U.S. Bank accolades as , businesses can drive down costs, reduce manual work and save time through the use of robust card controls, integrated accounting, intuitive receipt capture and more – all within a single, easy-to-use dashboard.
The card – which has a sleek, translucent design – also offers:
- Purchase Security: When you use your card, your purchases are protected if an item is stolen or damaged.
- Extended Protection: Get an extra year on eligible warranties – automatically – when you use your card.
- Rewards on prepaid travel: 5% cash back on air, hotel and car reservations booked directly in the Travel Center when you use your card.
- Annual statement credit: $50 annual statement credit with $5,000 booked in the Travel Center when you use your card.
- Pay over time: Plan annually, available after introductory APR period.
- Additional protection benefits: zero fraud liability, auto rental collision insurance and cell phone protection.
To learn more about the Business Shield Card, visit .
Disclosure:
The creditor and issuer of this card is U.S. Bank National Association, pursuant to a license from Visa U.S.A. Inc., and the card is available to United States residents only.

Even after this year, the One Big Beautiful Bill Act will continue to help small businesses because Congress made the 20% small business deduction and these changes permanent. Permanency provides the clarity and stability businesses need to plan confidently for the future, ensuring they can reinvest in their workforce, expand operations, and drive economic growth.
Unleashing Growth Through R&D Expensing
The 2025 law’s restoration of immediate expensing for U.S.-based R&D costs stands as a major victory for American innovation.
As Natalie Kaddas, CEO of Kaddas Enterprises in Utah, explains: re-instatement of immediate R&D expensing lifts a punishing tax burden that stifled investment for the past three years when companies were forced to amortize R&D costs—tying up much-needed capital. Kaddas Enterprises faced a 35% effective tax hike for each year they were forced to amortize R&D instead of expensing it immediately. Now, freed from this drag on cash flow, small firms can invest in operational upgrades and energy-resiliency efforts, fueling progress that benefits local communities and the national economy.

Victoria Thomas, President of VICCI Inc., echoes this sentiment from Wisconsin’s motorsports industry. By allowing business owners to amend tax returns for refunds on previously amortized R&D, her team is unlocking more than six figures to grow, hire, and innovate. It’s not simply about balance sheets; it’s direct evidence that the tax change incentivizes American manufacturing and supports Thomas’s strategic partners like Riley Technologies, which is already experiencing a surge in custom, high-performance car orders for 2026.
Making Productivity Investments Possible
The new tax law’s impact isn’t limited to research—it also directly addresses capital investment and productivity.
Traci Tapani, co-owner of Wyoming Machine in Minnesota, provides an example of how the law’s 100% bonus depreciation for new equipment creates opportunity and reduces risk. Before this reform, smaller manufacturers could deduct only 40% of the cost of major technology purchases in the first year and 20% in the second. The new rules allow full deduction up front, whether investing in cutting-edge fiber optic laser welding or other advanced tools.
For Tapani, the purchase of a new fiber optic laser welding machine, enabled by passage of the One Big Beautiful Bill Act, not only boosts productivity but also addresses chronic shortages in highly trained welders. Fiber optic welding is easier to use and less damaging to materials, allowing Wyoming Machine to serve a wider array of customers and industries.
Clarity and Confidence for Growth

Perhaps the most underrated gift of the One Big Beautiful Bill Act is confidence—clear, permanent rules that help business owners plan for the future.
As Mike Zaffaroni of Liberty Landscape Supply in Jacksonville, Florida, explains, uncertainties over whether a small business deduction for sole proprietors, partnerships, and S corporations would be extended beyond the end of this year made long-term decisions difficult. The new tax law made that 20% small business deduction permanent and put an end to this anxiety. The permanent restoration of 100% bonus depreciation and the deduction for R&D costs are also helping Zaffaroni turn wish-list projects into business realities—like a $100,000 upgrade in enterprise software, truck purchases, and new hires to meet customer demand.
When small businesses can plan ahead, they invest, expand, and hire. That ripple effect strengthens communities and helps secure America’s economic leadership.
]]>
To help communities respond to this challenge, the U.S. Chamber of Commerce and the AEI Housing Center have developed Strong Foundations: A Playbook for Housing and Economic Growth—a first-of-its-kind resource offering data-informed insights and practical strategies tailored to thousands of local jurisdictions across the country.
Explore Your Customized Housing Playbook
This unprecedented collection includes more than 6,000 tailored playbooks for:
- All 50 states
- 500+ metropolitan areas
- 1,000+ counties
- 4,500+ cities
Each playbook provides location-specific insight into housing supply, affordability, migration patterns, homelessness, and more—helping policymakers, business leaders, and community stakeholders identify opportunities to unlock housing supply and strengthen America’s economic resilience.
What’s Inside?
Analysis performed by the American Enterprise Institute, results in a set of playbooks written in partnership with the U.S. Chamber—each one highlighting opportunities to expand housing supply, including:
- Pathways to increase housing supply in your area
- Housing affordability across comparable states and cities
- Job growth versus new construction trends
- Migration maps
- Displacement and homelessness data
- Rent burden across occupations
U.S. Bank and Operation HOPE in 2020 debuted HOPE Inside, a partnership aimed at helping participants reduce debt, increase savings and improve credit scores.

That first foray featured one coach focused on credit and money management at a branch in Aurora, Colorado. Five years later, the program has grown to 10 coaches located in branches across California, Colorado, Illinois, Minnesota, Nevada and Wisconsin. Five coaches are bilingual, three are dedicated to small business and two are certified with the U.S. Department of Housing and Urban Development.
Not only has the program physically expanded, it’s also evolved. All coaches are now paired with U.S. Bank business access advisors and mortgage partners to leverage their combined expertise to support program participants on their financial journeys.
“We’re changing financial futures by restoring hope and making financial goals attainable for my clients and community,” said Chicago-based Operation HOPE Inside coach Felicia Adams.
Plans are also underway to expand access to existing U.S. Bank HOPE Inside coaches to additional branches this year to support more members of the communities served by U.S. Bank.

HOPE Inside is accessible to anyone in the community, not just U.S. Bank customers. In areas where coaches are located, individuals can be referred to a HOPE Inside coach by bankers. Coaches work with clients on a range of topics, including managing a budget, building savings, improving credit scores, preparing for home ownership and developing a small business.
“Our partnership with Operation HOPE and its coaches help guide business owners with genuine care, turning financial data into clear, confident steps that empower their everyday entrepreneurial dreams, which complements our commitment to power human potential,” said Will Jackson, a business access advisor in Oakland, California. “This is a well-rounded approach to providing access not just to capital but to information and connections needed to thrive.”
Since 2022, over 8,443 unique clients have been served. In addition to individualized coaching, HOPE Inside coaches have run nearly 2,015 workshops. These workshops range from a few hours to five weeks on topics such as credit and money management, first time homebuyer, and small business development, where participants can walk away with a full business plan.
The program can make a significant impact on participants’ financial health. On average, clients see a 38-point increase in their credit scores, with 50% experiencing an improvement. Additionally, there has been a median reduction of $2,023 in revolving debt, with 40% of clients successfully reducing their debt. Savings have also seen a boost, with a median increase of $750 and 71% of clients increasing their savings.
The program has also contributed to the creation of 83 small businesses and 49 facilitated mortgages, further empowering individuals to achieve financial stability, growth and generational wealth.
“I live less than a mile from the Slauson & Crenshaw Branch (in Los Angeles) where we house a dedicated Operation HOPE office. I have personally witnessed the incredible impact Operation HOPE has had in my community,” said Malgy Blue, branch and small business market leader for Los Angeles. “Their mission aligns perfectly with U.S. Bank’s commitment to financial health, creating a natural partnership that can expand opportunity and drive lasting impact. Together, we can help more people achieve financial confidence and a brighter future.”
]]>