Lack of trust between individuals and between individuals and institutions is a chronic problem in Latin America and Caribbean and often linked to inequality. After all, in a region that ranks among the most unequal in the world, it is natural to distrust political elites who seem to coopt government and ensure that policies favor the wealthy over the poor. Moreover, when government seems to represent elites, it is easy to believe that each person is on their own, that they cannot trust their fellow citizens to work together for the common good. All this is terrible for democracy. It is also terrible for economic growth, which requires high levels of interpersonal trust and faith in institutions to foster risk taking and greater economic activity.
The problem of inequality and trust can be seen empirically in the case of Latin American and Caribbean countries. Using Gini coefficients as a measure of inequality on one hand, and data on interpersonal trust from the World Values Survey (WVS) on the other, the figure below (Figure 1) shows the negative correlation between trust and inequality in Latin American and Caribbean countries. Countries from the region concentrate in the quadrant where the lowest trust levels and the highest inequality ones meet.
Figure 1. Relation between Trust and Inequality: Country Average
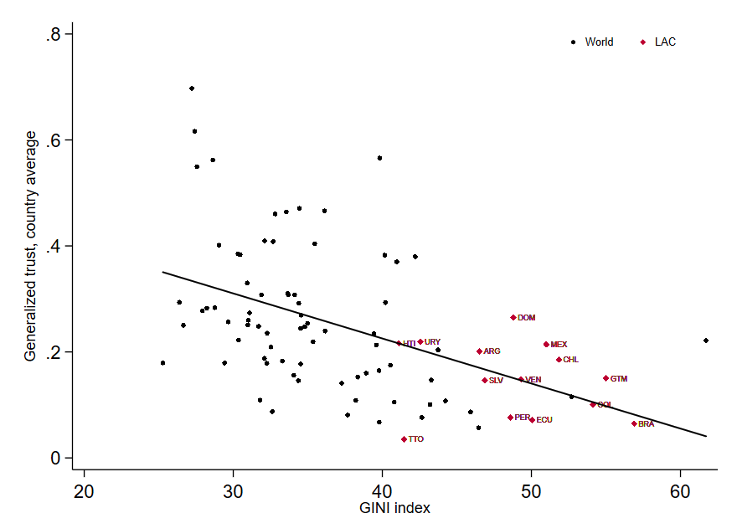
Notes: The trust data come from the six waves of the World Value Survey (1981 – 2014). GINI Index data comes from World Development Indicators, The World Bank (1981 – 2017). The total sample has 88 countries including Argentina, Brazil, Chile, Colombia, Dominican Republic, Ecuador, El Salvador, Guatemala, Haiti, Mexico, Peru, Trinidad and Tobago, Uruguay, and Venezuela.
Looking at the data in more detail, wealth appears not to be as a strong predictor of interpersonal trust as one might have expected. Rather, people’s perceptions of inequality are essential, even when those perceptions do not always accurately reflect their place in the income distribution. Factors like access to public goods, including education and health, as well as vulnerability to crime can also be crucial to people’s sense of income fairness.
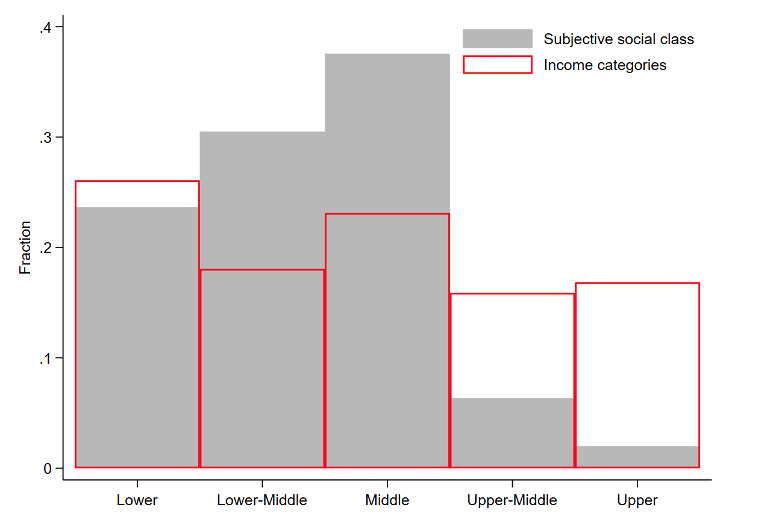
The truth is that people are not very good at correctly identifying where their income lies in regard to national income levels. Moreover, they find it hard to evaluate the distribution of income dispassionately, as their social preferences make them strongly averse to earning less than others. Figure 2 below explores those biases. It uses people’s perception of their social class from a Latin American Public Opinion Project (LAPOP) survey against wealth and self-stated income. In both panels, individuals in the higher quintiles of income and wealth distribution tend to believe that they belong to a lower class than that shown by their registered income or household wealth. At the other extreme of the distribution, poor people tend to overestimate their place in the income distribution.
Figure 2. Under-/Over-Estimation of Income and Wealth
A. Social class and income distribution.
B. Social class and wealth distribution.
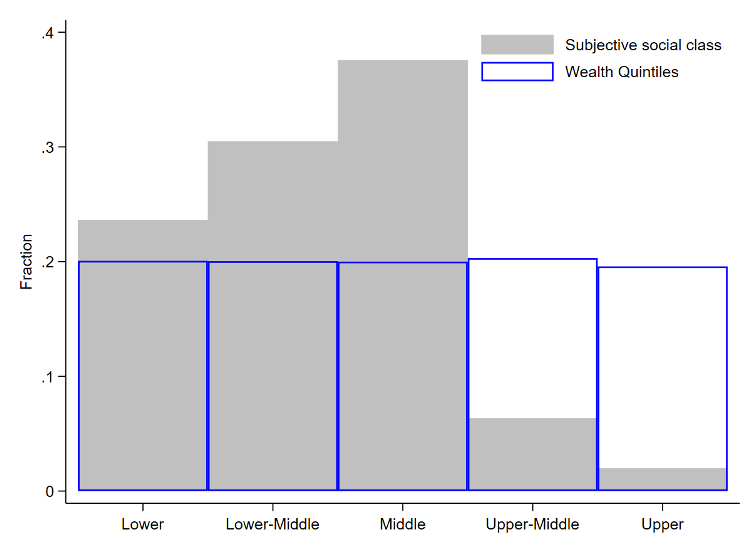
Notes: The wealth quintiles were created from the HH Asset Wealth Index (PCA) using a set of 10 binary variables that states different household assets and characteristics. After that, according to the score, each household was assigned to a bin from 1 to 5 to generate wealth quintiles, as a proxy for household income. Social class is a self-assessment, and income levels are self-reported by the respondents. The no income bracket was included in the lowest class and represents 3.99 percent of the entire sample. The sample includes data from three waves: 2014, 2016, 2018/2019.
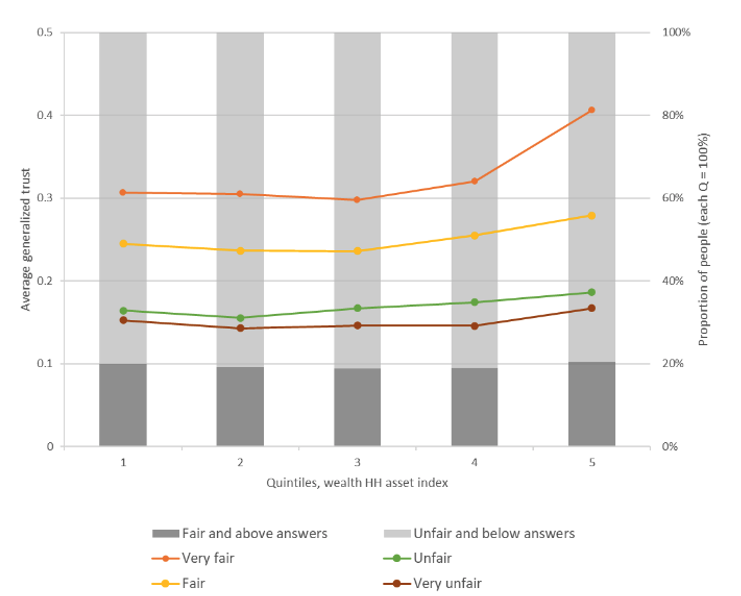
How do these biases influence individuals’ trust? Figure 3 captures some of the dynamics. For example, Panel A shows trust levels by wealth quintiles and for different degrees of perceived fairness in the income distribution. The lines indicate the levels of trust for each quintile and each level of perception regarding income distribution (left vertical axis). The bars identify the share of people who think that the distribution is fair or unfair (right vertical axis). Interestingly, despite the fact that interpersonal trust rises slightly across the wealth distribution, it is respondents’ perceptions that make more of a difference. Panel B reveals another important piece of evidence: Very few people in the entire sample, regardless of their wealth quintile, consider themselves part of the upper class (the darker bar increases only slightly with actual wealth).
Figure 3. Individuals’ Perceptions of Wealth May Be More Closely Correlated with Trust than with Wealth
A. By perceived fairness of income distribution.
B. By self-assigned social class
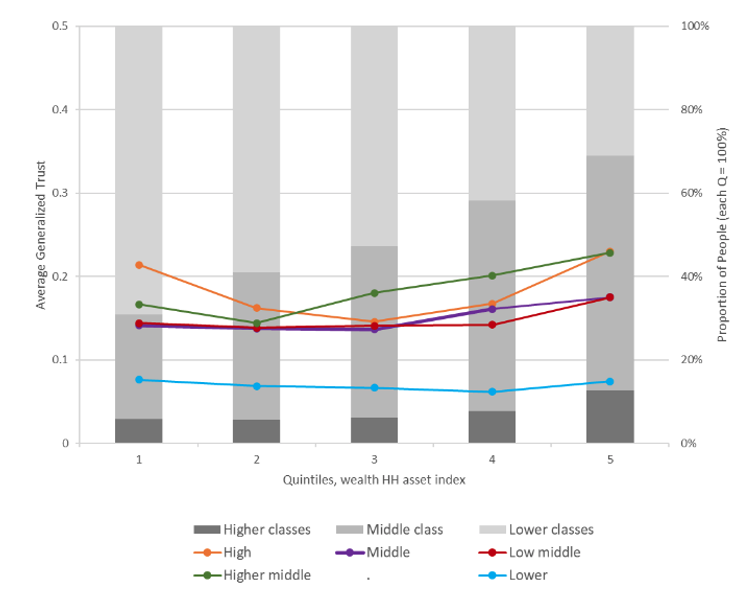
Notes: Generalized trust is calculated from answers to the question, “Generally speaking would you say that most people can be trusted, or that you need to be very careful in dealing with people?” Trust is equal to 1 if the respondent answers, “Most people can be trusted” and 0 otherwise. The quintiles were created from the Household Asset Wealth Index (PCA) using a set of binary variables representing various household assets. The variable related to the perceived fairness of income distribution comes from the question: “How fair do you think income distribution is in your country?” Social class is self-assigned by the respondent. For Panel A, the eleven years used in the sample fell between 1997 to 2018. For Panel B, the sample years are 2011, 2013, 2017, and 2018. Eighteen countries are included: Argentina, Bolivia, Brazil, Chile, Colombia, Costa Rica, the Dominican Republic, Ecuador, El Salvador, Guatemala, Honduras, Mexico, Nicaragua, Panama, Paraguay, Peru, Uruguay, and Venezuela.
These figures illustrate the wide gap between reality and perception. But how are these perceptions formed? Taking as an example one of the perception variables – the fairness of income distribution – some compelling results appear from the regression analysis. First, wealth is not statistically significant in explaining people’s perceptions regarding the fairness of income distribution, after controlling for individual and neighborhood characteristics. Second, elements like education, access to public goods (i.e. education, health), or a person’s experience with crime do have a significant effect on such perceptions of fairness. Further analysis, with different perceptions variables, can be found in this technical note.
Older and more educated individuals tend to think that the income distribution is more unfair than younger and less-educated individuals. Both crime and corruption victims tend to have a worse view of the income distribution, as do those who have access to worse education and health services. Indeed, neighborhood characteristics and personal experiences tend to determine perceptions about inequality more than actual differences in relative wealth. (Figure 4)
Figure 4. Determinants of Fairness in Income Distribution Perceptions.
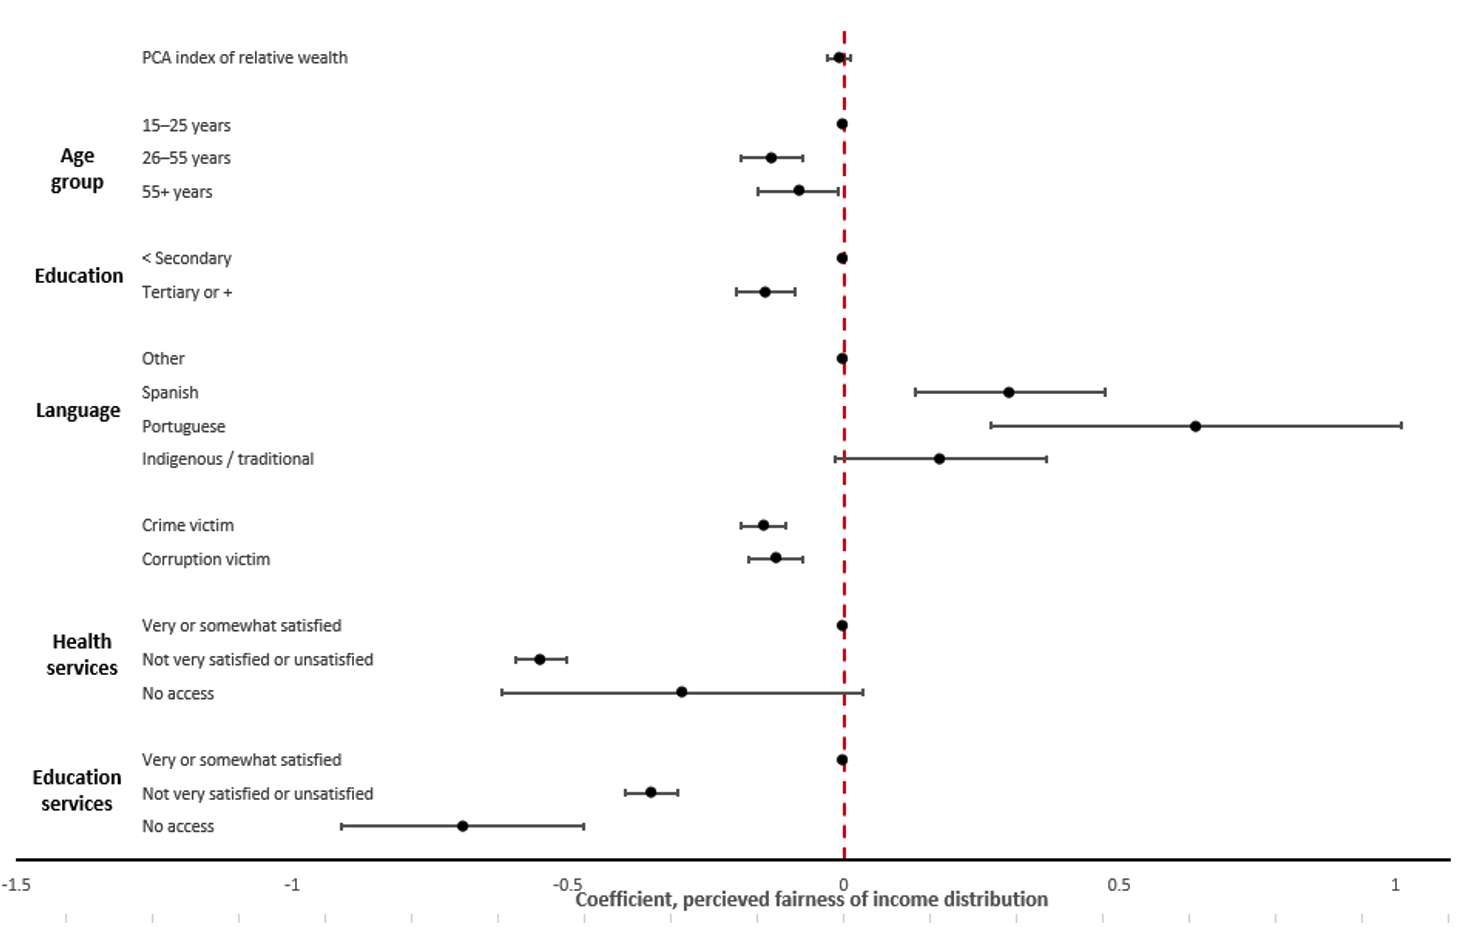
Notes: The dependent variable, the perceived fairness of the income distribution, comes from the question: “How fair do you think income distribution is in your country?” The scale of answers ranges across very unfair, unfair, fair, and very fair. An ordered logistic regression was used with robust standard errors, at a 90 percent confidence interval. Dots represent coefficients of regressions, and the lines are confidence intervals. The total sample consisted of 28,860 individuals in 18 countries across the region, taken from the 2007 and 2016 surveys.
None of this is to say that inequality is not hugely important as a social and psychological factor. But governments and policymakers also have to consider the role of perceptions when designing policies aimed at boosting social cohesion. Based on the evidence, closing the inequality gap in terms of income and wealth might not be enough to increase trust or even inclusive growth if people’s perceptions about their relative income are inaccurate.


