


When we think about infrastructure’s contribution to the region’s economies, we look at the direct effects’ investment in bridges, airports, and power grids have on growth. A new highway can drive economic growth by increasing demand for construction materials, stimulating demand for vehicles to use it, and reducing travel times.
But infrastructure’s contribution to growth can also come from other channels. One of them is greater efficiency in the provision of water, power, and transportation services. In addition to the impact on growth, changes in the efficiency of the provision of services can also impact other economic outcomes, for example, income distribution. This is because consumption of these services is a significant component of family budgets, especially for the poorest households.
How can we quantify the potential economic gains of greater infrastructure efficiency? In the book From Structures to Services: The Path to Better Infrastructure in Latin America and the Caribbean, we use a computable general equilibrium (CGE) model. It’s like a map that replicates an economy at a scale that is manageable for researchers seeking to model reality as closely as possible. The structure we use consists of approximately 30 productive sectors on the supply side, including four infrastructure sectors: power, water and sanitation, transportation, and telecommunications.
On the demand side, there are five representative households (with different income levels), and the government. In each market, production and utility functions govern the behavior of producers and consumers, respectively, and determine how they interact. Producers and consumers exchange goods and factors of production. For example, companies purchase intermediary inputs from other sectors, receive revenue from their sales, compensate factors of production, and pay taxes. On the demand side, workers receive salaries—an important component of household income—and consume and invest. The government collects taxes and also consumes and invests. The model estimates the changes in relative prices needed to match supply with demand in the markets. These changes in prices then influence the trajectory of economic growth by redistributing resources among economic sectors. They also produce changes to the structure of the economy and the distribution of income.
The first step in calibrating the model in a country is to set up a social accounting matrix (SAM). The SAM shows the flow of all economic transactions taking place in an economy over the course of one year. It is basically a matrix representation of the national accounts—that is, a narrow description of how different productive sectors, households, and the government interact to generate the goods and services that the country produces. SAMs show a single year and provide a statistical snapshot of the economy..
The SAM for each country is used to obtain a starting point (or equilibrium) for the variables, providing a growth baseline with a time horizon of 10 years. In this solution for the model, the calibrated parameters governing the sectors’ productive functions (that is, the “efficiency” with which goods and services are produced) are determined by the corresponding SAM. In other words, the initial equilibrium is the “business as usual” scenario. This provides a baseline against which contrafactual scenarios can be compared. In the contrafactual scenarios, different equilibriums are simulated based on a variety of productive and technological shocks that alter the baseline scenario.
The advantage of CGE models is that they offer a general equilibrium framework that makes it possible to track the impact that simulated changes have while taking into account the interconnectedness of the different parts of the economy. With this tool in hand, we are able to study the potential impact of small improvements to the productivity and efficiency of services on economic growth and on the distribution of income, compared to what would have been the outcomes without the improvements.
For example, an efficiency improvement in the energy sector could be a thermal power plant that uses a more efficient technology that, as a result, uses less gas to produce the same amount of electricity. An improvement to productivity could be a redesigned plant that can produce the same amount of electricity using fewer factors of production—that is, less labor and/or capital. From a conceptual point of view, we capture improvements to productivity and efficiency assuming increases of 5% in the technical coefficients of the productive functions of infrastructure sectors as of the first year of the simulation.
The results indicate that relatively small increases to productivity and efficiency with which infrastructure services are supplied can have significant benefits (see Figure 1). On average, the selected countries see their growth rates increase by a cumulative 3.5 percentage points over a period of 10 years. Extrapolating across Latin America and the Caribbean, this would represent an increase in GDP of close to US$200 billion over a decade.
Figure 1. Impact of Infrastructure Productivity and Efficiency Gains on GDP Growth
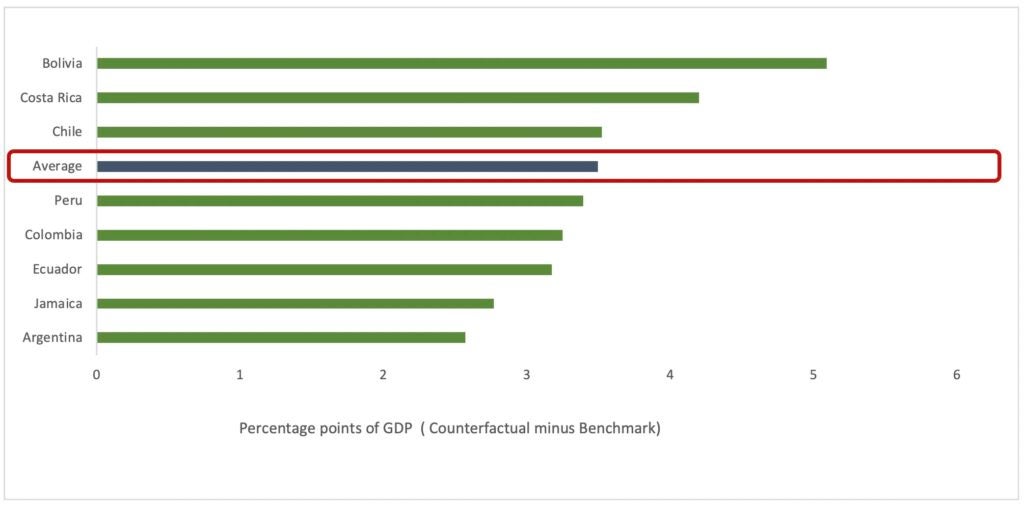
Note: The figure shows the cumulative change—in GDP percentage points—of the contrafactual scenario (that is, the scenario with efficiency improvements) minus the baseline scenario (that is, without changes to the parameters) over the course of 10 years.
The results also show that improvements to the productivity and efficiency of infrastructure services increase real incomes across the income distribution. At the country level, income increases range from 2.8 percentage points for the average citizen in Jamaica, to 5.4 percentage points in Bolivia (see Figure 2). But improvements to infrastructure productivity and efficiency benefit low-income households more than high-income households. For all the countries in the sample, except Jamaica and Ecuador, the incomes of the two poorest quintiles increase proportionally more than that of the two richest quintiles. The difference in relative growth is an average of about 28% in favor of the poorer quintiles. The effect is particularly noteworthy in Chile (where the increase in income for the bottom 40% of the population is 70% higher than that of the top 40%) and in Peru (40%).
Figure 2. Impact of efficiency gains on household income
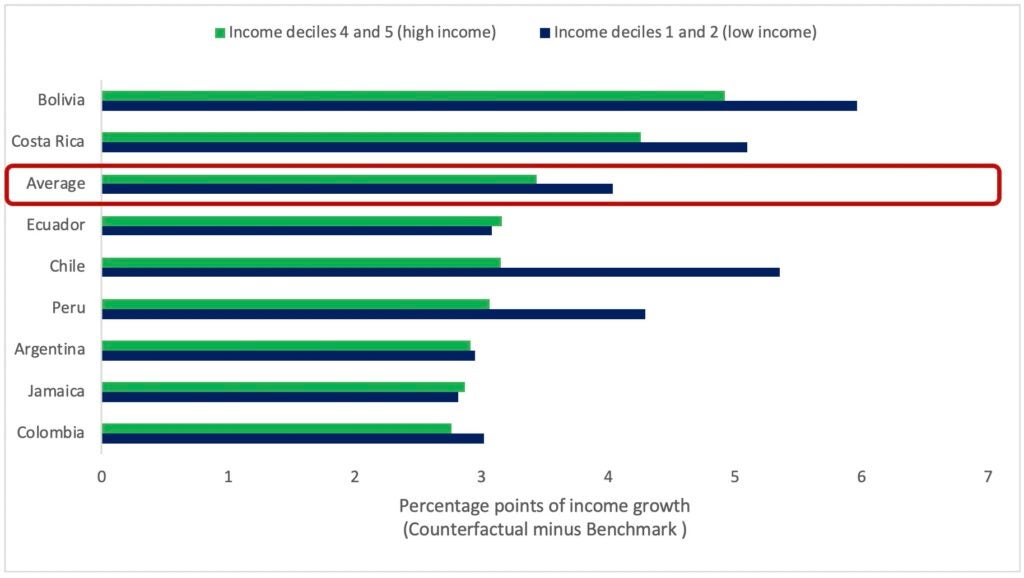
Note: The figure shows the cumulative change—in real income percentage points—of the contrafactual scenario (that is, the scenario with efficiency improvements) minus the baseline scenario (that is, without changes to the parameters) over the course of 10 years.
Like all economic models, ours is not perfect. But the results are consistent and tell us that improvements to infrastructure productivity and efficiency would increase economic growth and reduce income inequality. Finding the public policies to encourage these improvements is therefore crucial for ensuring the region experiences sustained and inclusive economic development, especially considering the urgency of finding ways out of the crisis brought on by the COVID-19 pandemic. The opportunities are available, and they must be grasped without delay.